PhpReport Introduction
⚠️ Please note that we are in the process of rewriting PhpReport. We are trying to keep up with updating the documentation, but there may be some pages that remain in flux during the rewrite.
PhpReport developer documentation
⚠️ Please note that we are in the process of rewriting PhpReport. We are trying to keep up with updating the documentation, but there may be some pages that remain in flux during the rewrite.
These documents provide insight on the architecture of the application and they are intended for developers working on the code base to implement new features, fix bugs or implement plugins.
- Setting up a development environment
- Overview
- Data model
- Data access layer
- API
- Business logic layer and plugin system
- Web service layer
- User interface
- Application Roles and Permissions
Setting up a development environment
Some steps described here overlap the ones described in the installation instructions.
Using Docker
Inside the docker folder you can find all the Dockerfile and docker-compose
files for several enviroments. To run the development setup, copy the
.env.example to .env and update it to the values of your environment.
In the root .env, use these values
DB_HOST=db
...
API_BASE_URL="http://phpreport-api:8555"
In the frontend/.env, use the following:
VITE_OIDC_REDIRECT_URL='http://0.0.0.0:5173/web/v2/'
VITE_API_BASE='http://0.0.0.0:8555'
You need docker and docker-compose running and you can run it from the root folder of the project with:
docker-compose -f docker/docker-compose.dev.yml up
During the first time running the app, the API will fail because it needs to access the database tables that still don't exist, so run the migrations to create the tables with:
docker exec -ti phpreport-api alembic upgrade head
Kill the containers and run them again, so the API can connect to the database correctly.
[Optional] When running the project for the first time, you can add some basic data for the development environment:
docker exec -dti phpreport-db psql phpreport -U phpreport < sql/initialData.sql
If you make changes to the models and want to create migrations:
docker exec -ti phpreport-api alembic revision --autogenerate -m "Migrations description"
All the services are setup to reload when the files are updated without the need of rebuild the containers.
If you are using an external OAuth provider, you will also need to add a user to the database with the same username as your OAuth user because PhpReport will match on the username. To do this, you will want to run the following commands once your db container is up and running:
docker exec -ti phpreport-db bash
psql -U phpreport
INSERT INTO usr (id, password, login) VALUES (DEFAULT, md5('myusername'), 'myusername') RETURNING id;
This will echo the id of the user you just created. Keep this terminal open. Now
you will need to also add some permissions to your user. To do this you'll need
to insert the user id into the belongs table along with the proper group id.
The default group ids added are as follows:
| id | name |
|---|---|
| 1 | staff |
| 2 | admin |
| 3 | manager |
If you want your user to have the highest permission level, then run the
following and replace {your user id} with the value returned when you inserted
your user: INSERT into belongs VALUES(1, {your user id}), (2, {your user id}), (3, {your user id});
If you want your user to have lower permissions, then remove whichever groups from your INSERT statement you don't want your user in.
If you've given your user the highest permissions, then you'll be able to use the interface to create clients and projects to use for creating tasks.
Dependencies
Follow the corresponding section from the installation instructions. Make sure to also install composer as specified there.
Additionally, a development environment may need the following dependencies to generate minified versions of the JS code and the documentation pages:
- Fedora: package
uglify-js. - Debian/Ubuntu: package
uglifyjs.
NOTICE: UglifyJS version must be 3.15 or above.
For the React frontend, you will need to run npm install inside the frontend folder. Make sure that you have Node.js version 20 or higher.
For the Python API, make sure you have Python version 3.11 or higher.
Setting up the database
From the api folder, run the migrations with
alembic upgrade head
Create a new migration with
alembic revision --autogenerate -m "Migrations description"
For more details check the alembic documentation.
History tracking in database
As part of the migrations, an archive table is added to the database along with a function to log to this table and a trigger to captures changes on the project table. A trigger using this function can be added to track the history of any table. To do so, create a migration with the following (with the customer table used as an example):
    customer_trigger = PGTrigger(
        schema="public",
        signature="trg_make_archive_of_changes_for_customers",
        on_entity="public.customer",
        definition="""
        after insert or delete or update on
            public.customer for each row execute function make_archive_of_changes('Customer')
        """
    )
    op.create_entity(customer_trigger)
Setting up the files
Clone the PhpReport repository https://github.com/Igalia/phpreport in
a location available to the web server. The usual default location for
the Apache web server is: /var/www/html/
Alternatively, clone it elsewhere and create a link from the web server directory.
You must also run composer dump-autoload -o inside PhpReport root
directory, so it can generate the autoload files. Then, run
composer install to install the project dependencies.
Creating the schema and initial data of the database
The configuration file with the default values already exists in the repository, so you don't have to touch it unless you changed any data in the first step.
Then, you can follow the step three in the installation instructions (either the manual or the wizard setup) to create the schema and initial data.
Setup autogenerated files
You can optionally minify the JS source with make minify. You should
be able to debug it because there are source map files in place, but
take into account you would have to re-generate them with make minify
every time you modify a .js file. In a development environment, it's
probably better not to minify the sources.
Create necessary .env files in your project
Using the .env.example as a template, create an .env at the root and one inside frontend and set the values to fit your environment.
Running the API
Before you try the application, you'll want to get the API server running. To do so, follow the instructions in the api documentation section
Running the frontend (React)
If you only want to want the React portion of the frontend and not the PHP portion, you can run npm run dev in the frontend folder. This will spin up a server at `http://localhost:5173/web/v2'
If you want to run everything together (exisiting PHP app, new API, and new frontend), it is easiest to run npm run build in the frontend folder. This will compile your JS to the web/v2 folder.
Try the application
Use a browser to open the correct URL of your web server (very likely,
http://localhost/phpreport), then use the user name admin and the
password admin to try a user with full privileges, or user with
password user to try a login with restricted permissions. You will
also be able to create users with any permission level once you are
logged in as admin.
Running automated tests
There 2 types of tests in the project: unit and integration tests.
The unit tests will work locally without issues, but the integration tests will only work if there is a service running on the port 8000 with the data from the [sql/initialData.sql]{.title-ref} file. In that case it's easier to run it with docker, as it has everything setup.
In one terminal build and run the application and the database:
docker-compose -f docker/docker-compose.test.yml up --build --renew-anon-volumes
In a second terminal run the test container to run the tests:
docker-compose -f docker/docker-compose.test.yml run -T test
If you don't want to setup docker, it's possible to run only the unit
tests. Make sure you have composer and the projects dependencies
installed. To install the dependencies run composer install in the
project root directory.
All the automated tests should be placed inside the tests directory.
From the project root, run ./vendor/bin/phpunit --testdox tests/unit
to execute the automated tests.
Documentation
The application documentation is published using mdBook. To preview the output of mdBook locally, ensure you have mdBook installed, then run mdbook serve at the root of the project.
API documentation is autogenerated using the OpenAPI standard. When running locally, you can view those docs at http://localhost:8555/docs. The FastAPI framework also provides docs at http://localhost:8555/redoc if you prefer ReDoc to Swagger.
Linting and Formatting
The API uses Flake8 for linting and Black for formatting.
The frontend uses ESLint and Prettier.
Overview
Architecture
The application is structured in several layers, as displayed in the following figure:

- The persistence layer is implemented by the database system, in particular PostgreSQL. Data is modelled following the relational model approach.
- The data access layer interfaces the program with the persistence layer, translating the data in the database into program objects. It isolates the program from the database implementation, theoretically allowing the integration of different DB systems.
- The business logic layer implements the business logic and exposes it as a set of operations grouped in Facade objects.
- The web service layer exposes the operations from the layer below in the network using a REST approach.
- The user web interface has been built in a way it can use the business logic layer directly for synchronous operation and the services in the web service layer for asynchronous operations.
- External client applications may be implemented on top of the web service layer.
Directory tree
The code is structured in the following directories:
- config: configuration files of the application. Contains configuration of user group permissions.
- docs: contains documentation source files.
- admin: documentation for system administrators about installation, configuration and upgrade of PhpReport.
- developer: documentation for developers.
- user: end user documentation explaining all the features of the application.
- help: auto-generated directory for documentation in html format. It is not part of the sources but part of the release tarballs.
- install: complete sources of the installation wizard.
- model:
- dao: data access objects of the data access layer.
- vo: value objects of the data access layer.
- facade: sources of the business logic layer.
- sql: sql sources to generate the basic persistence layer for
PhpReport 2.0.
- update: changes to the basic persistence layer done in later releases.
- test: unit test suite.
- update: scripts to migrate the application between releases.
- util: utility source code used along different layers of the architecture.
- web: sources of the user web interface.
- ext: contains the entire Ext JS 3.x framework.
- include: utility source code for the web interface, imported Ext JS widgets and other resources like CSS, images, etc.
- js: JavaScript sources of the web interface.
- services: source code of the web service layer.
Data model
Design
The next diagram shows the theoretical vision of the data model, in which the best practices related with the normalisation of the data have been followed. However, the implementation contains a change that contravenes these norms: the original primary keys of all the entities have been replaced by numerical identifiers acting as keys. The reasons of this change are, on the one hand, efficiency, avoiding the keys formed by multiple attributes. On the other hand, convenience, since these numerical keys can be autogenerated by the database. Besides, numeric ids can be used to keep a reference between database objects and external objects, for example, objects in a client application.
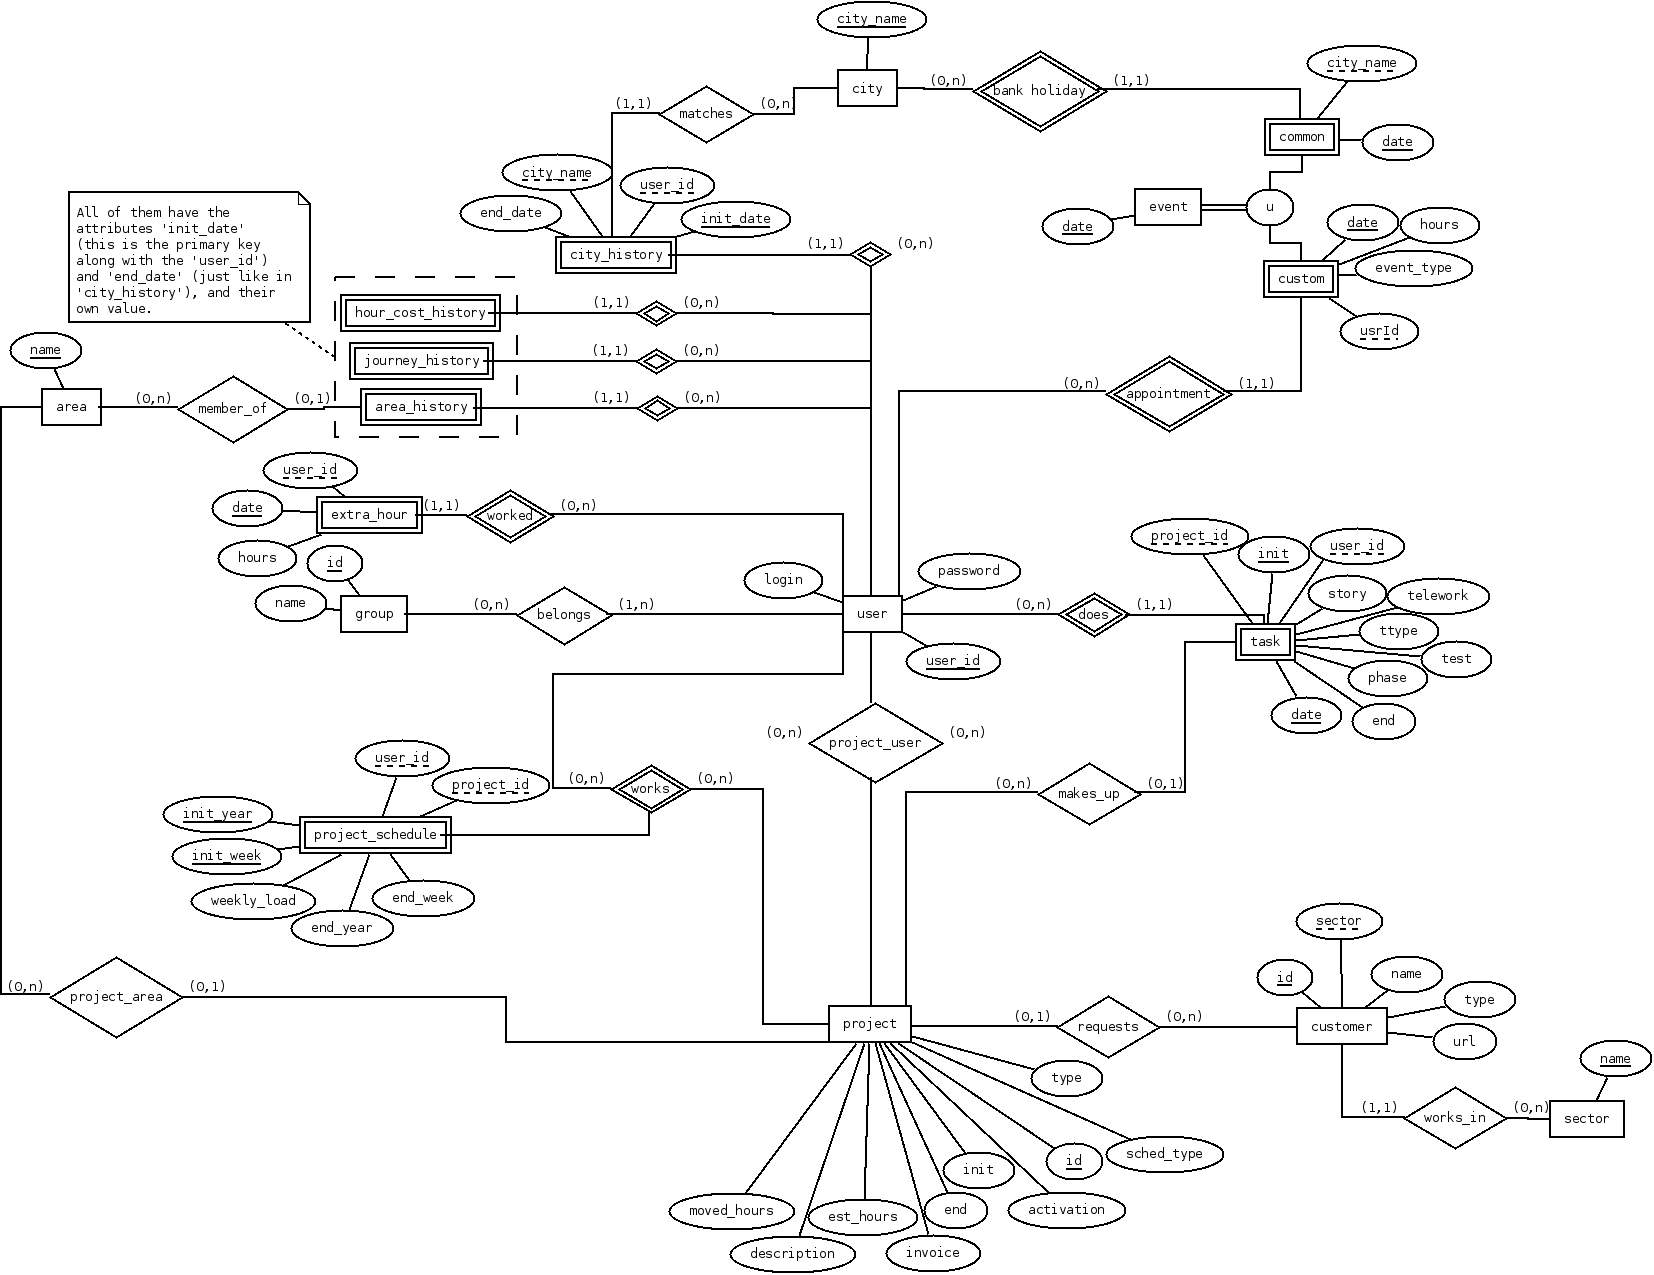
To describe in brief the model of data, we will mention the most important entities and relations:
- The entity task could consider the main object of the application, since the main purpose of PhpReport is to store, classify and extract information about tasks. It has important relations with user and project, that serve to classify the task.
- The entity user is used mainly to control the access to the application, besides classifying tasks. There is a series of entities related with user that provide valuable information when they combine : the relations with event, city_history, journey_history do calculations on the working time, and hour_cost_history on the cost.
- The entity project is used to classify and group tasks. It is interesting to mention the relation called works with user, which could be used to restrict the access to certain information in the application.
- The entity customer classifies projects.
- The entity sector classifies customers.
- The entity area classifies projects and users. The relation between areas and users happens through the entity area_history which stores the history of that user belonging to areas.
- The entity group defines levels of access in the application.
- The entity extra_hour is used to reset the calculation of extra hours of an user in a determinate date.
- The entity event provides basic support for work calendars. It stores a list of dates which are considered non work days in a certain city.
- The entity city represents the city to which the worker is or has been assigned, through city_history.
There are entities related with unimplemented features:
- Project_schedule to define project weekly schedules.
- Custom events to define personal work calendars, independently from per-city calendars.
Data access layer
Purpose and design
The data access layer is in charge of the transformation between the data stored in persistence and the objects that are treated by the application. In its design we have used the patterns Data Access Object (DAO) and Value Object (VO), in addition to Singleton, Template Method and Abstract Factory.
DAO design
The following two figures show the structure of three DAOs and the classes related with them. They are the model for any DAOs in the system; there are two hierarchies of DAOs: those that extend BaseDAO, which define the operations on tables that represent entities, and those that extend BaseRelationshipDAO, which define the operations on tables that represent relations.

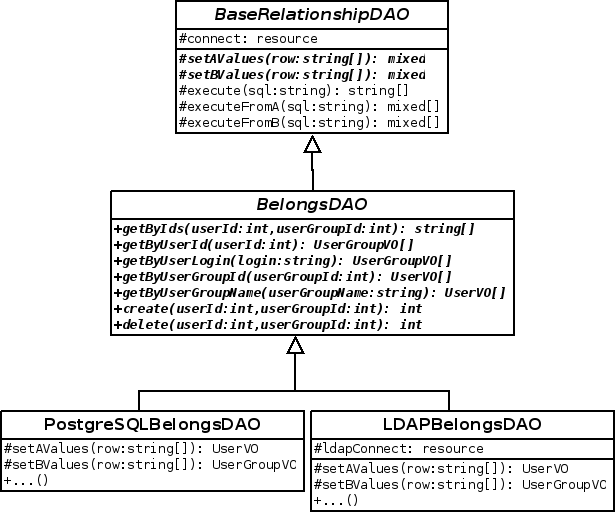
In both hierarchies there are three levels of inheritance:
- The first level contains the parent classes for all the DAOs of a certain type.
- In the second level is composed by abstract classes, one per table in the DB, that define the operations on that table.
- In the third level there are implementation details for specific different DB management systems.
Starting by the first level of inheritance, see that the class BaseDAO defines two template methods, setValues and execute, whereas the class BaseRelationshipDAO defines some more: setAValues, setBValues, executeFromA and executeFromB. They are used to be able to implement some DB operations in a generic way, leaving the specific parts of the DB manager isolated inside these functions, which will be implemented in a lower level of the hierarchy.
The classes in the second level of inheritance group the operations on each table of the DB. There is one class per table, and contains quite a lot of methods; some implement CRUD operations (create, update and delete), others run queries on the table in function of diverse parameters, and others are entity-specific operations, like login for the entity User or add and delete users from a group in UserGroup.
In the third level of inheritance, template methods for DB-specific operations are implemented, in addition to those methods that have some dependency on the DB management system. For example, the operation login uses an encryption function specific to PostgreSQL, therefore it is implemented in PostreSQLUserDAO.
VO design
Value Objects, from now on VOs, are object representations of tuples in the DB. There is a VO class for every table that contains all its attributes, together with getter/setter methods to manipulate them. These objects are usually instantiated in the DAO as a result of a query, although they also can be instantiated in upper layers with the purpose of running a DAO creation operation.

The figure above shows all the VOs of the application. Most of them are implemented only with one class, although there are some special cases. On the one hand, we have the BaseHistoryVO hierarchy, an abstract class grouping a set of attributes, together with their access methods, that are common to several VOs. On the other hand, we have the CustomProjectVO class, which extends ProjectVO with a set of additional attributes. These attributes do not directly correspond with any data of the DB, but they are calculated in base to one or several of the basic attributes of projects and related entities. The calculations are done when the CustomProjectVO is instantiated in the corresponding operation of the projects DAO, and their results are destroyed when the custom object is destroyed; they are never stored in the persistence layer. The additional attributes in the custom object are interesting for several project data visualisation screens, and is a good idea to implement the algorithm for their calculation in one point of the application model layer.
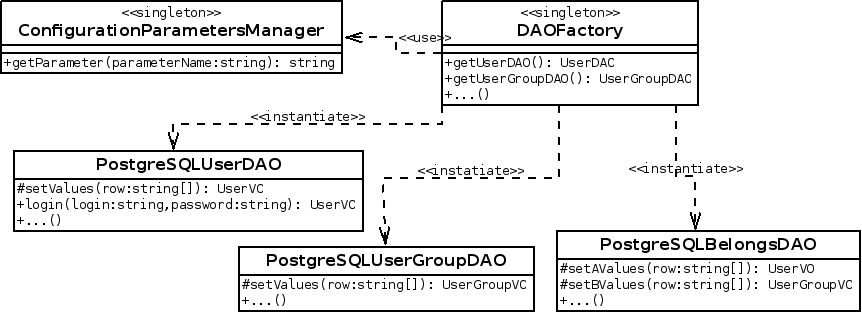
DAO factory
To ensure the independence between the specific implementation of DAOs and the upper layers of the application, DAOs are instantiated through the DAOFactory singleton class. This class has methods to get instances of any DAO, and is albe to select the suitable implementation of each DAO in run time from the content of application configuration file. To access the configuration file it uses the class ConfigurationParametersManager.
The figure below illustrates the design of this class and its main relations:
DAO implementation configuration
There are two ways to configure the specific implementation of DAOs. In the application configuration file, there is a parameter to define the implementation to be used as a general case, while there is an individual parameter for every DAO that allows to replace its specific implementation independently from the rest of them. The DAOFactory object is the one that manages this logic, according to the next sequence diagram:
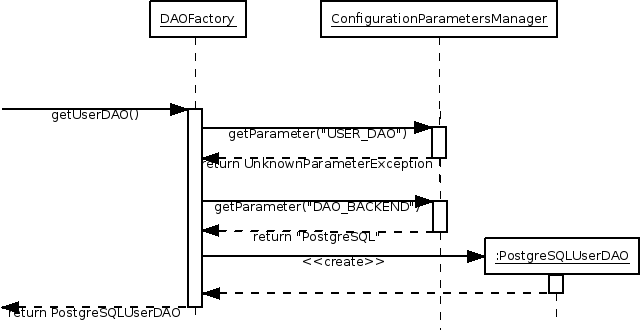
This feature supports the implementation of LDAP authentication support and can be used to implement certain scenarios of integration with external services, for example, integrate an external calendar service to supply work calendars.
API
The API is built using FastAPI.
Requirements
Python > 3.11 Pip virtualenv
Install dependencies
Activate the env and install the dependencies
virtualenv .env
source .env/bin/activate
pip install .
Setting up the DB and running migrations
Run the migrations with
alembic upgrade head
Create a new migration with
alembic revision --autogenerate -m "Migrations description"
For more details check the alembic documentation.
Run FastAPI
Inside the api folder, make sure you have the virtual environment
activated and all the dependencies installed.
Start the server with uvicorn main:app --reload --host localhost --port 8555
User web interface
⚠️ Note that we are currently in the process of implementing a React frontend that will eventually replace all of the existing pages. Any new features/pages will be implemented in React. The code for this new frontend is in the
frontendfolder.
The user web interface is mostly implemented in JavaScript, using the Ext JS 3.x library. There are some small parts written directly in HTML and PHP, which cover the basic UI blocks and access control, respectively.
Page structure
Every page in PhpReport is structured in a set of predefined areas: header, menu bar, content area and footer:
- The header must be included from the
web/include/header.phpfile. It contains the generic includes of JS libraries and CSS files, and defines the page header where the application name is shown. - The menu bar contains the application menu and is included from
web/include/menubar.php. - The content area is where the contents of the particular PhpReport
screen are rendered. It usually contains a
<div>area with thecontentid, but it is completely free. It is implemented by every page, usually in two different files. For example, the tasks screen is implemented byweb/tasks.phpandweb/js/tasks.js. - The footer is the bottom area from the page and must be included
from the
web/include/footer.phpfile. It closes the HTML tags opened by the header.
Access control
The access control to the application is implemented at page level, using a configuration file and the utility class LoginManager written in PHP.
When accessing to the application, the initial page requests a name of user and password; with these data, calls the method login of LoginManager. This method checks the credentials of the user calling the login operation of the model layers through the users facade object and, in case of success, it stores the user object in the PHP session.
From now on, every page has to run two operations before beginning:
- In the first place, has to invoke to the method isLogged of LoginManager to know if the user has already initiated session in the application. For this, the method checks the data in the session and if there is already a user, as it should have been stored by the login operation, it continues the process.
- The second step is to invoke to the method isAllowed of LoginManager. This method queries a configuration file that keeps the relations between user groups and the pages of the application to which they have access. Checking the groups to which the current user belongs, it will know if the process of loading the current page may continue.
Because the process above happens for every page (excepting login
pages), it is implemented in /web/auth.php which is included from
every page.
Relation with other application layers
It has already been commented, the user web interface is related both with the layer below, the business logic layer, and with the web service layer. It may use the former for synchronous operation and the latter for asynchronous operations. The next sequence diagram illustrates the access control implementation as we have just explained:
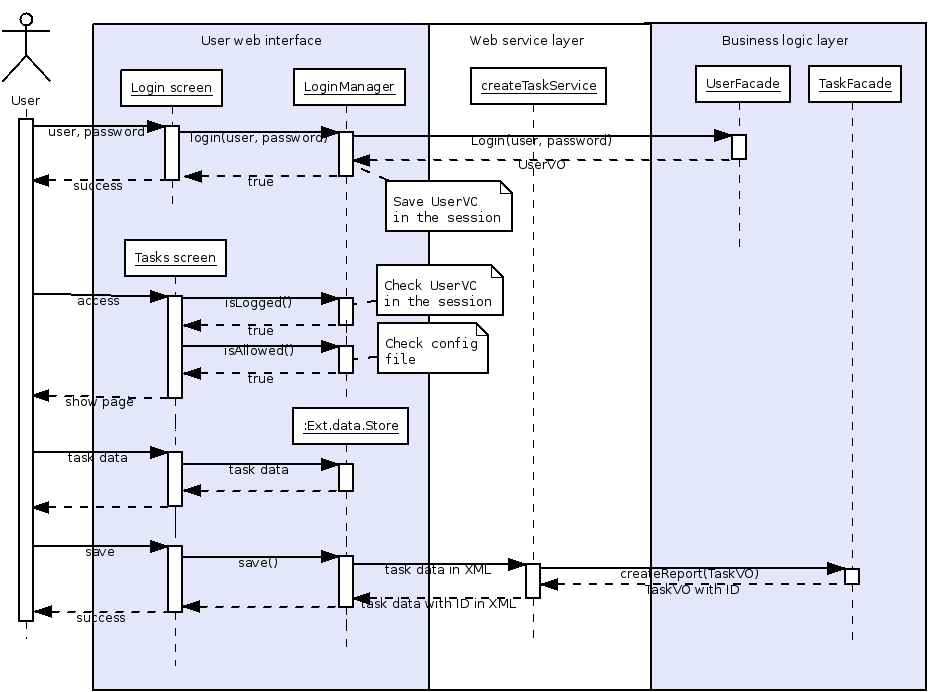
On the one hand, some screens may directly use the PHP code from the layer below. This happens when asynchronous interaction has no value. For example, the login screen: the user has to fill up all the data, send them and wait for an answer, which may be an error message or a redirect to inside the application. This has been developed with an HTML form and a small block of PHP code that calls the login function of the business logic layer. In the sequence diagram it can be seen how the process of the login operation bypasses the web services layer.
On the other hand, in the majority of the cases the interaction happens using the web services layer as an intermediary. For example, these are the steps that comprise the creation of a task:
- An user creates a task and fills up its data. This happens in the browser, without the server being aware of it. In particular, there is an object Ext.data.Store that stores the information of all the tasks that are shown on screen.
- When an user presses the Save button, the code of this event invokes the method save() of the Store. This object is already configured to use the URL of the createTask web service, and is in charge to build the XML and send it by means of an asynchronous request.
- The service createTask transforms the XML received in a TaskVO object from the application domain and calls the task creation method in the tasks facade.
- The service receives the return of the creation method and composes an XML with a success or an error message if it was the case. This XML is sent back to the client.
- The asynchronous request gets the response it had been waiting from the server. This triggers an event that shows the result of the operation in screen to the user.
Business logic layer and plugin system
Purpose
This layer implements the busienss logic of the application and exposes it as a set of operations grouped in Facade objects. In its design we have used the patterns Facade and Business Delegate, in addition to Singleton, and Template Method.
Business logic layer design
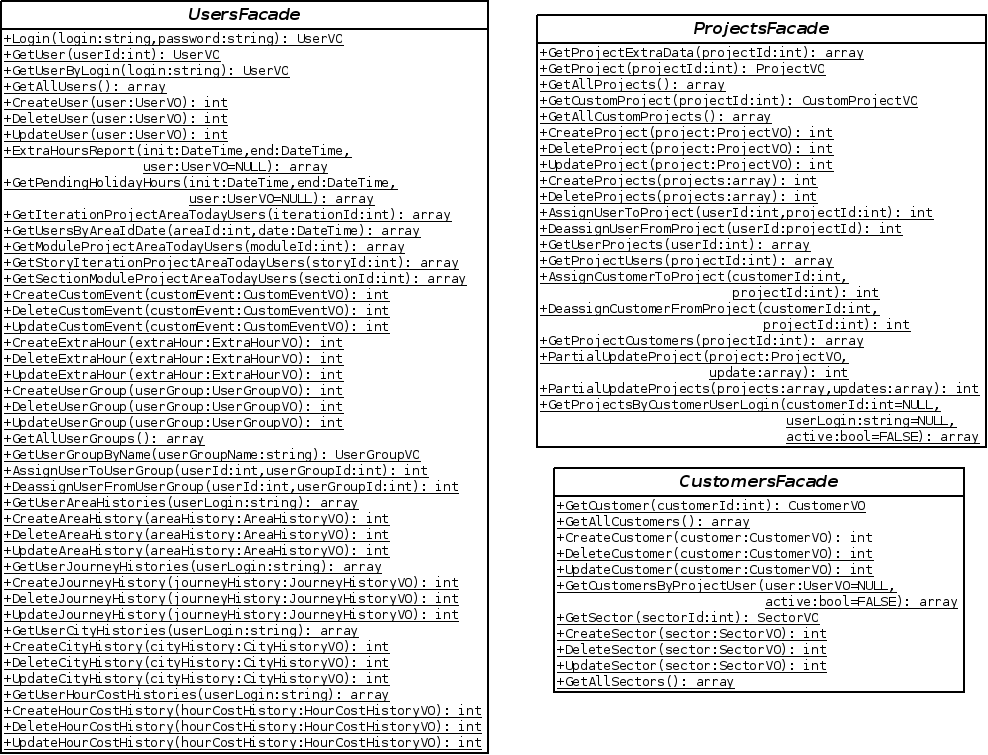
The XXFacade classes expose the interface of the business logic layer. Each one of them consists in a grouping of logically related use cases, where each use case is a method. We are not interested in the existence of different implementations of the business logic, therefore the Facade classes are Singleton with a concrete implementation. Find below an example with some of these classes:
However, the implementation of the logic does not reside in the interior of the methods of the facades, but it is delegated in the hierarchy of Action classes There exists a XXAction class for every method of in the facade, which implements the logic of that particular use case. The role of the methods in the facades is instantiate the corresponding action object, execute it and return its results. This relation is shown in the next diagram:
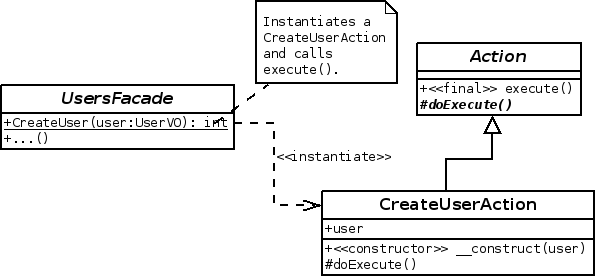
The Action classes are an implementation of the Bussiness Delegate pattern. They implement the business logic of the application model of while hiding it to client code that uses it.
Plugin system
The diagram below shows in detail the implementation of an Action class. In our design, they do not only implement the business logic, but they also provide the support for plugins, code blocks which are added before or after the execution of a task in the business logic.
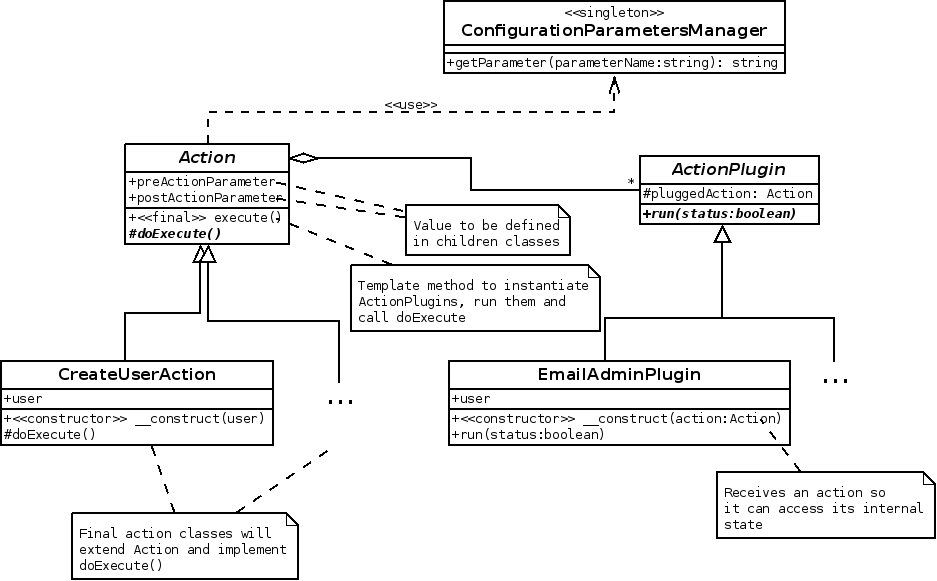
The Action class has one public method called execute(), which is the only entry point to the code of the operation. Its children classes, one per operation in the business logic, redefine the template method doExecute(), where they actually implement the task. The reason for the existence of these two separate operations is that execute() also takes care of the management and execution of any plugins associated to its action. The process is detailed in the next diagram:
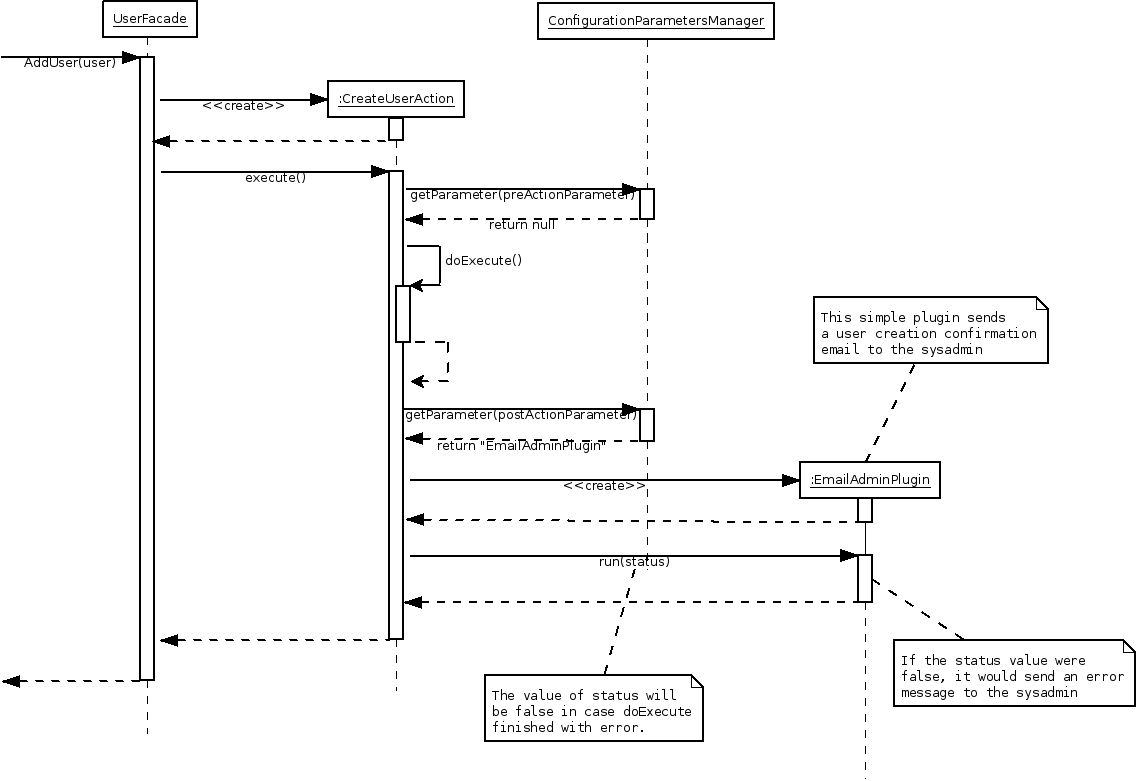
According to the sequence diagram, when the method execute() in CreateUserAction is called, it makes a call to the ConfigurationParametersManager to check if that action has any associated plugins that should be previously run. As the result is negative, it continues and runs doExecute(), which actually implements the user creation. Once it has finished, if checks if there is an associated plugin to be run after the action, and finds one called EmailAdminPlugin. In this moment, the class is loaded and instanced, and its run() method is called.
Configuration variables are used to enable the execution of plugins, hence the dependency between the Action class and the ConfigurationParametersManager The name of the configuration variables that control the plugins for a particular action is stored in the attributes preActionParameter and postActionParameter, which are defined in the Action class their value set in the child classes.
Web service layer
In order to provide the functionality of PhpReport to external applications, independently of the programming language, a layer of web services has been created.
Design
The design of the services is inspired by the REST architectural style. They use the protocols and standards already defined by the World Wide Web to model and implement the services. Mainly, it's based in the HTTP protocol for access to resources and the exchange of messages between the client and the web service.
The services are located in the URL web/services/ in the server
hosting PhpReport. They use the HTTP operations GET and POST to receive
and send data, respectively; with both operations, using additional
parameters in the URL of the service, it is enough for us to implement
all the needed tasks. It can not be said that the services follow REST
strictly, since the URLs do not represent resources, but operations, and
the operations PUT and DELETE are not used.
Classification of services
Regarding the type of client going to use the services, can distinguish two types:
- Services intended to be used by external applications. These services can be used either by the external customers or by the user web interface.
- Services created specifically to support the user web interface. The difference is these services have little utility outside of the web interface. They usually contain metainformation for visual configuration of the UI widgets.
And regarding the language of the messages transmitted, there are:
- Services using XML; the majority of them.
- Services using JSON; some services in which the client (usually a specific widget in the UI) demands it.
Session management
PHP session management has to be considered in the implementation of web services. This is usually handled by the web browser transparently for both users and programmers. It may use cookies or GET parameters in case the former are not available. However, when the client is not a browser, programmers have to take session management into account explicitly.
Session management uses a login service that returns an identification token when the operation finishes properly. This token is associated to the PHP session PHP so that, in future requests to web services, the client has to send the token as a parameter so the application can associate it to some active session. This manual management is unnecessary in the case of the web interface because the browser takes care of this transparently.
Therefore, only external client applications using PhpReport services should take session management as explained here into account.
Usage
To illustrate the operation of web services, we will show the messages exchanged in the case of the task creation service. A summary of this interaction can be seen in the next sequence diagram:
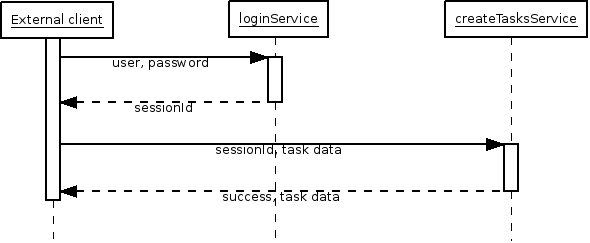
To begin with, we have to authenticate using the login service. We invoke the service URL, sending the authentication credentials in the HTTP Authorization header:
GET /phpreport/web/services/loginService.php HTTP/1.1
Host: localhost
Authorization: Basic b'YWRtaW46YWRtaW4='
If the login data were correct, it returns:
<?xml version="1.0"?>
<login>
    <sessionId>elr51a4trslb07qo5lngcq0ef0</sessionId>
</login>
We have to use the sessionId that we have received to call the URL of the task creation service, using a operation POST the following way:
POST /phpreport/web/services/createTasksService.php?sid=elr51a4trslb07qo5lngcq0ef0
The content of the POST request is this XML message, generated by the client:
<?xml version="1.0"?>
<tasks>
    <task>
        <date>2009-10-29</date>
        <initTime>00:00</initTime>
        <endTime>03:00</endTime>
        <customerId>10</customerId>
        <projectId>196</projectId>
        <ttype>hjgjhg</ttype>
        <story>jhgjhgjk</story>
        <text>uyefsdgfdghfdhgf</text>
        <telework>true</telework>
    </task>
    <task>
        ...
    </task>
</tasks>
Whereas the application will answer like this in case of success:
<?xml version="1.0"?>
<return service="createTasks">
    <success>true</success>
    <ok>Operation Success!</ok>
    <tasks>
        <task>
            <id>149620</id>
            <date>2009-10-29</date>
            <initTime>00:00</initTime>
            <endTime>03:00</endTime>
            <customerId>10</customerId>
            <projectId>196</projectId>
            <ttype>hjgjhg</ttype>
            <story>jhgjhgjk</story>
            <text>uyefsdgfdghfdhgf</text>
            <telework>true</telework>
        </task>
        <task>
            <id>149621</id>
            ...
        </task>
    </tasks>
</return>
Or like this, in case of error:
<?xml version="1.0"?>
<return service='createTasks'>
    <success>false</success>
    <error id='2'>You must be logged in</error>
</return>
Notice that this service returns a list with the tasks that have been saved, in case of success, but including an additional piece of data: the internal identifier of the task. In successive calls, the client has to use this identifier to update the data of the task.
Testing the services
The page web/APITest.php can be used to test the services. It provides
a field to set the service URL, and another field to set the content of
the POST request. After the "Send" button is hit, the response will be
printed on-screen.
Please, notice that PhpReport releases do not include this test page, developers must have created a development environment. Besides, they must be logged in as an admin to be able to access it.
Application Roles and Permissions
Concepts
Scope
A scope is a concept used to specify access privileges. They are often used in access tokens. We are using them here for authorization to perform actions inside the application. We have constructed scopes in the following way:
{object/area}:{action}-{action scope}
For example, task:create-own is the scope we use to delineate whether a user has permission to create tasks for themselves (i.e., tasks they own). As noted in the permission matrix below, sometimes a user will have permission to perform CRUD operations for items they own, but not for other items of the same type.
The following is a chart of available objects/areas, actions, and action scopes used in the application. If no additional action scope is specified, it is because there are no owners for that object type; lookup tables - such as task_type - are good examples of types that will have no action scope specified.
Action scopes used
In this application, we define our action scopes this way:
own: object/area a user owns, e.g., a task one creates for oneself or a project where the user is project manager
global: unowned item global to all users, e.g., global templates
assigned: item user is assigned to or associated with, but doesn't own. An example would be a project a user is assigned to.
other: action scope that allows a user to access an owned item that are not associated with. A 'human resources' user, for instance, might need to be able to create a long leave for another user or add their capacity (hours/week) for a time period. We also might want to allow any user to see when other users are on vacation for planning purposes.
| Object/Area | Action | Action scopes |
|---|---|---|
| task | create, read, update, delete | own, other |
| template | create, read, update, delete | own, global |
| task_type | create, read, update, delete | |
| project | create, read, update, delete | own, assigned, other |
| client | create, read, update, delete | |
| project_status | create, read, update, delete | |
| dedication | create, read, update, delete | own, other |
| user_capacity | create, read, update, delete | own, other |
| long_leave | create, read, update, delete | own, other |
| vacation | create, read, update, delete | own, other |
| config | create, read, update, delete |
Some examples
template:create-global gives permission to a user to create global templates (for use by all users), which is different than template:create-self which allows creation of a template for oneself.
vacation:read-other gives permission for a user to view any other user's vacation.
Role
A role is simply a set of scopes. It is a quick and convenient way to assign a set of scopes to a user.
There are several predefined roles for the application:
- Staff
- Manager
- Admin
- Human Resources
- Project Manager
You may set these roles in your OAuth provider or use the application database. If you prefer to use the local database, please make sure that the roles above are added to the user_group table. You assign a user to a role by creating a row in the belongs table with the user's id and the group id of your role. If you prefer to set the roles in your OAuth provider instead, please make sure to set USE_OIDC_ROLES to true and also pass the roles back on the access token at the root level. You will also need to set the OIDC_ROLES_PROPERTY in the .env to the property name on the access token object that will contain the roles (e.g. OIDC_ROLES_PROPERTY="roles").
You can also choose to use your own roles. Just make sure to add the proper sets of scopes to these roles.
Matrix and Legend
Legend
✅ = allowed
⚠️ = partially allowed
For instance, a Staff user can see project details for projects to which they have been assigned, but not for other projects. Or a Staff user can create vacation for themselves, but not others.
⛔️ = not allowed

PhpReport user documentation
PhpReport is a web application for time tracking, which provides useful statistics about users, projects, and more. These documents provide the basic concepts to use PhpReport both for worker and manager profiles.
- Overview
- Tasks management
- Reports
- Projects management
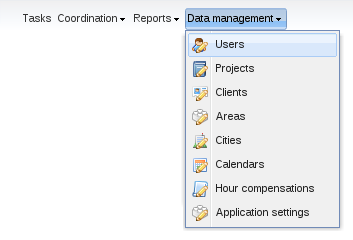
- Users management
- Clients management
- Cities and work calendars management
- Management of other entities
- Application settings
Overview
PhpReport is an open source web application for time tracking, focused both on project control and working day management. It tries to provide useful data for workers and managers about the way time is devoted to projects.
Data model for time tracking
The core purpose of PhpReport is being able to track the time devoted to work by members of an organization, and which part of that time is devoted to every running project. The core of the time tracking revolves around these four entities:
- Task entity represents a task performed by a user in a date, with a determinate length stored in its start and end time.
- User entity represents a user of the system, who is meant to be a member of the organization being tracked. Every member is supposed to be working and tracking their hours in the system.
- Project entity represents a project, a common goal for a set of tasks.
- Client entity represents an organization who requests a project.
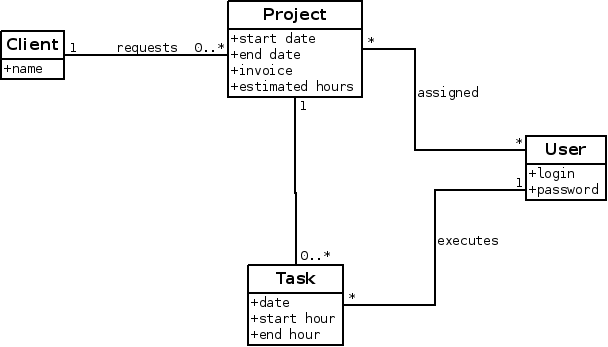
The relations stablished between them are the following:
- Every task belongs to one user; users can execute any number of tasks.
- Users are assigned to projects, with no constraints of number of users or projects.
- Every task belongs to one project; projects can have any number of tasks.
- Clients request projects; a client can request more than one project but each project is requested only by one client.
Data model for working day management
PhpReport can calculate the number of hours users are supposed to work and track the balance of extra or undone hours. It can also take into account public holidays to do that calculation. These are the new entities introduced with this purpose:
- City entity represents a city, because public holidays are usually set at city level.
- Public holiday entity represents one public holiday which belongs to one city.
- City history entity represents the history of cities to which a user has belonged, between two dates.
- Journey history entity represents the number of hours a user is supposed to work per working day between two dates. PhpReport considers there are five working days per week, from Monday to Friday, excepting public holidays.
- Extra hour compensations entity represents a moment in time where the calculation of extra hours for a particular user is reset to a new figure, ignoring all the previous history.
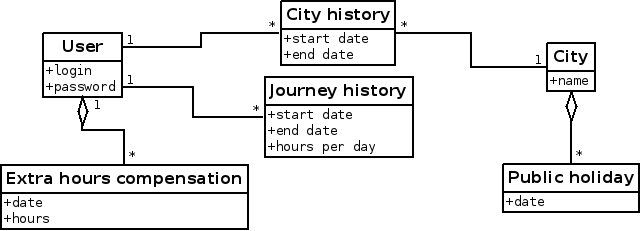
Relations between these entities:
- A user can have any number of associated city history entities, as long as the time periods of these history entities don't overlap.
- In the same way, a user can have any number of associated journey history entities, fulfilling the same condition about overlapping.
- One city history entity can only be related to one city, as a consequence a user can't be member of multiple cities at the same time.
- Finally, a city can have any number of public holiday entities. One public holiday entity can only be related with one city, so if the same date is a holiday in different cities there must be two entities with the same date but different relations.
- A user can be associated with any number of extra hours compensation entities.
Data model for project cost management
PhpReport can estimate the cost, deviation, benefit and other economical data of your projects. The related entities are:
- User, Project and Task entities, already introduced.
- Hour cost history entity, it represents the history of the cost per hour for a user in different time periods.
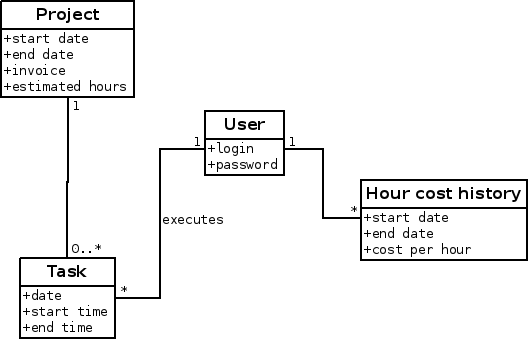
This is the explanation of the relations stablished between these entities:
- A user can have any number of associated hour cost history entities, as long as the time periods don't overlap.
- The application can know the number of hours devoted to a project by every user, through the relation with task entity and its relation with project entity. Using the date of the tasks and the relation with hour cost history, the cost of every work hour can be calculated.
Data model for organization structure
PhpReport structures the organization in areas, to which users and projects belong. This is a breakdown of the related entities:
- User and Project entities, already introduced.
- Area entity, it represent an area of interest inside the organization.
- Area history entity, it represents the history of the membership of a user to different areas.
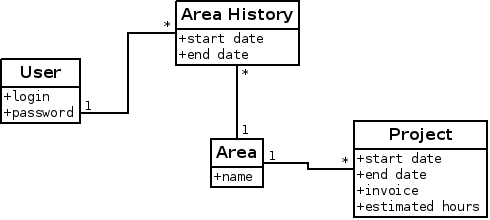
Relations between these entities:
- A user can have any number of associated area history entities, as long as the time periods don't overlap.
- One area history entity can only be related to one area, as a consequence a user can't be member of multiple areas at the same time.
- Finally, a project belongs to only one area, while an area can have many projects.
Data model for holiday management
PhpReport can also calculate the number of holiday hours corresponding to every worker according to their contract and journey conditions. Holidays are treated as tasks belonging to a specific project called "Holidays". Users taking one day of holidays should fill a task specifying that project, and with a number of hours equal to the length of their working day (which is 8 hours by default).
The entities involved in this process are:
- A specific project called 'Holidays'.
- The Task entity, in this case represents used holidays.
- A configuration parameter called
YEARLY_HOLIDAY_HOURS, it indicates the number of holiday hours corresponding to one person in a year having a journey of 8 hours per day. The default value is 184 hours, which corresponds to 23 holidays per year. The application will adjust this value according to the specific case of every user, as specified below. - Journey history entity is also involved in this calculation,
adjusting the value of
YEARLY_HOLIDAY_HOURSto the situation of every user. E.g. a user working 4 hours per day would have 92 hours, and a person working from January to June would have 92 hours too, assuming the default configuration.
Tasks management
The first option in PhpReport top menu points to the task management screen. In this screen, users will be able to fill in their tasks, modify or delete them.
The tasks management screen
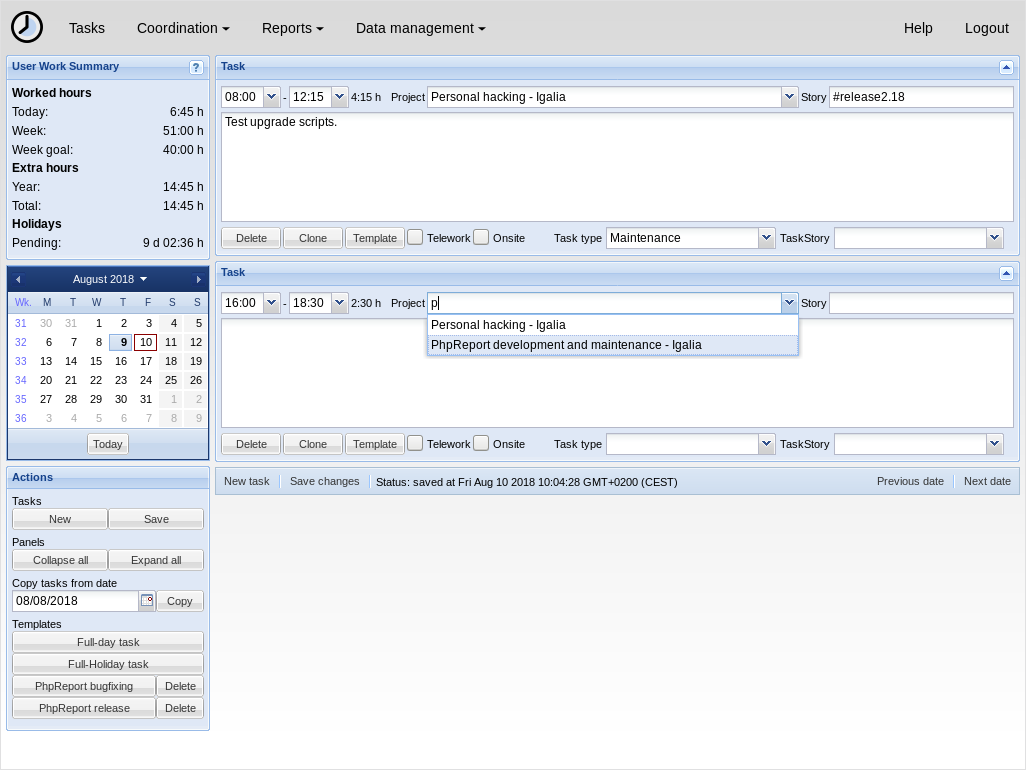
In the left column, you can find:
- User work summary: contains useful information about the user work status.
- Calendar: indicates the selected date and you can click on it to go to a different date.
- Actions: create new task and save changes, expand and collapse all the panels, copy tasks from another date and use templates.
In the central area, you will see the tasks stored in the currently selected date, one panel per task. All panels have the same components, some are used to fill the information about the task:
- Time: fill the start and end dates in.
- Project: project the task belongs to. You may search by the project or the customer name, users will only see projects they are assigned to.
- Story: you can fill this field with a keyword to help you to differentiate tasks inside the same project.
- Description: the big text area in the center can be used to write a description of the task.
- Task type: select one of the types for additional info about the task.
- Telework: flag to differentiate telework tasks.
- Onsite: flag to differentiate on-site tasks.
Actions in task panels:
- Delete: delete the task. Remember to save to do the actual deletion.
- Clone: creates a new task with the same data and empty times.
- Template: create a template based on that task. See Using templates section below.
- Collapse: the arrow icon in the top-right corner collapses the panel; it's useful to save vertical space when there are many tasks.
Below the list of tasks in the central area, there are two additional buttons for New task and Save changes, for easy tab-navigation. There are another two quick-access buttons to the next and previous dates.
Managing tasks
When you open the screen, the current day will be selected; if you are about to fill tasks for a different date select it from the calendar on the left. Be careful, if there are unsaved changes, they will be lost when you select a different date.
Fill the data of the empty task that pops up by default, and add any number of new tasks using one of the two New task buttons. There are more ways to create new tasks: using the clone button in a different task, using a template button, or copying from another date. Repeat as many times as you want until you have filled all the tasks of the day, changes will be auto-saved every some seconds, there is a message in the bottom bar that will let you know.
You can delete a task pressing the Delete button inside the task panel; the panel disappears but the deletion won't be saved until you do it manually with any of the two Save buttons.
Be careful with the start and end times of the dates, because they can't overlap; if they do, tasks won't be saved until you correct the problem and save again.
Using templates
Templates are useful when you create tasks with very similar data very often. They are listed in the Templates section, in the bottom of the left column. To create a new task from a template, click on the button with the name of the template.
To add new templates to this list, first you have to create a task; fill it in with the data you want to save as a template --- any field can be saved, and none of them is compulsory; finally, click on the Template button in the task box. You will be asked to provide a name for the template, and when you confirm it will be added immediately to your templates deck on the left side.
To delete a template, you only have to press the Delete button right to the button with template name in the list.
There are two default templates that cannot be deleted:
- Full day task will create a task and set its start and end times so it fills one full day of work. The values will be set according to the users' journey values.
- Full-holiday task works like the previous one, but will also set the project field to 'Holidays'.
Copying tasks from another date
A common scenario is having a person working in the same tasks for some days, usually with the same timetable. The copy feature is useful in this case.
In the actions box from the left column, there is a section named 'Copy tasks from date' containing a date selector and a 'Copy' button. When you press that button, the tasks saved in the indicated date will be copied to the current date. Take into account that copied tasks aren't saved until you press the save button.
The default date to copy from is the last date containing any recorded tasks, that's the most common use case. Finally, we must clarify that copied tasks can be modified without affecting the original ones.
Blocked tasks
Sometimes users won't be able to modify or delete some saved tasks, nor even create new ones on certain dates. It can happen because of two reasons:
- Managers have closed a project. In that case, tasks assigned to that project cannot be altered.
- Managers have blocked task reports for the selected date. In this case, even the New task and Save changes buttons would be blocked.
User work summary
The User work summary panel on the left contains information on worked hours, extra hours and holidays. Figures are presented in days, hours and minutes, where a day is calculated based on the configured user journey; e.g. for a 8-hour journey, 44 hours is 5 days, 4 hours.
Worked hours, today:
: Number of hours worked today.
Worked hours, week:
: Number of hours worked this week.
Worked hours, week goal:
: Goal for the selected week.
By default, it represents **the number of hours users must work per
week to finish the year with zero accumulated hours in that
period**. To put in in a different way, they would finish the year
with the same number of historically accumulated extra hours they
began it.

For example, if you have worked some extra hours in the last weeks
the weekly goal will become lower than your weekly schedule. This
way you will have a way to know how to handle your time and finish
the year with zero accumulated hours.

This value is calculated taking into account the users' journey
values and the amount of worked hours so far. For users whose
contract period is shorter than the year in course because they
started or will finish working along the year, or because they
changed contract hours (journey value) in that period, the time
period will be constrained to the contract dates.

For example, if a person was working full time in the first half of
the year and part time in the second half, there will be different
\"weekly goal\" periods for each half of the year and they work
independently: the hours accumulated in the first half are not taken
into account in the second.

Managers can customize per-user weekly goals with other time periods
and amounts of hours different of zero. Read more about this in the
[Setting user custom
goals](users-management.md#setting-user-custom-goals) section.
Extra hours, year:
: Number of extra hours corresponding to the current year.
Extra hours, total:
: Number of historically accumulated extra hours.
Vacation days, available for year:
: Holidays available to be used this year.
Vacation days, used:
: Holidays already used in the year. More particularly, these are holidays saved for dates in the past.
Vacation days, scheduled:
: Holidays scheduled for later in the year. More particularly, these are holidays saved for dates in the future.
Vacation days, pending:
: Holidays pending to be scheduled or used. This is (holidays available − used − scheduled).
Hotkeys
Some hotkeys are available to increase the productivity for keyboard users:
CTRL + S
: Save changes. Some browsers don't allow to overwrite the behaviour of this key combination (e.g. Epiphany), so you can use ALT + S instead.
CTRL + N
: Create a new task. The cursor will be placed in the first field of the new task. Some browsers don't allow to overwrite the behaviour of this key combination (e.g. Chrome), so you can use ALT + N, CTRL + U or ALT + U instead.
ALT + SHIFT + number
: The cursor will be placed in the first field of the first, second, third, etc. task depending on the number you pressed.
TAB
: Advance to the next field.
SHIFT + TAB
: Go back to the previous field.
LEFT, RIGHT
: Jump to the previous or next date, when keyboard focus is not inside a field.
Reports
PhpReport provides different reports to check the status of projects and users. They can be accessed in the Reports menu.
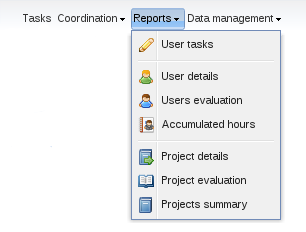
User tasks

This report retrieves the list of tasks introduced by a user which match certain conditions.
The top of the screen contains a box with all the available filters. In all cases, leaving a field empty means that the field won't be taken into account. This is the full list of available options:
User
: Filter tasks according to the user who input them. This is the only compulsory field, and it defaults to the current user. User with manager permissions are allowed to change it.
Dates between ... and ...
: Filter tasks according to their date. You can use only the first field to get the tasks since a particular date or only the second field to get the tasks saved before or at that date.
Task description:
: A text string can be set here to search it inside the description field of tasks. You can also select in a drop-down list the options [empty] or [not empty] to search the tasks that contain some text or no text in that field.
Project:
: You can filter the tasks assigned to a specific project selecting one from this list.
Customer:
: You can filter the tasks belonging to projects assigned to a specific customer selecting one from this list.
Task type:
: You can filter the tasks tagged with a specific task type selecting one from this list.
Story:
: A text string can be set here to search it inside the story field of tasks. You can also select in a drop-down list the options [empty] or [not empty] to search the tasks that contain some text or no text in that field.
TaskStory:
: You can filter the tasks related with a specific category inside a XP tracker iteration selecting one from this list.
Telework:
: You can filter the tasks tagged as telework or the opposite with this option.
Onsite:
: You can filter the tasks tagged as onsite or the opposite with this option.
The results are shown in the grid in the central area of the screen; rows represent tasks and columns represent the different data stored in them. You can export the data contained in the grid to a CSV file for processing with spreadsheet software, for example, using the Download as CSV button at the bottom of the grid. Finally, at the bottom of the box containing the grid there are two buttons named Standard view and Extended view. The first one hides some columns to show a more compact grid (it's the default option), while the second one shows all the columns.
User details
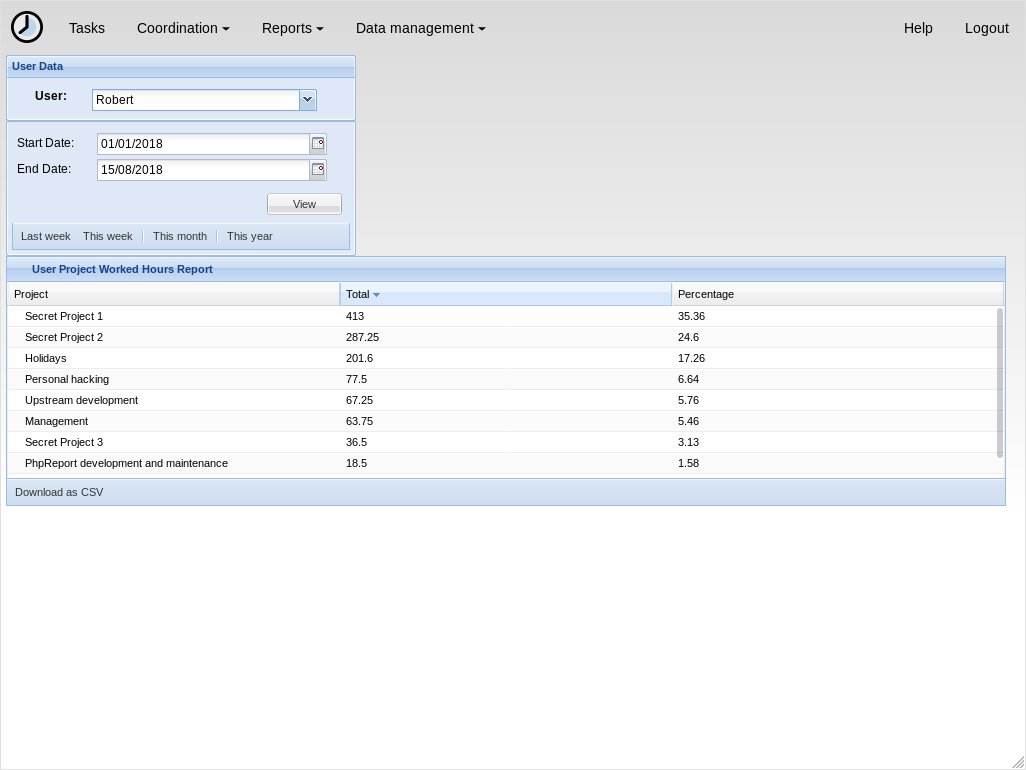
This report details the work of the logged user between two dates. It shows the time spent in every project.
The top of the screen contains two boxes with the available filters. This is the full list of available options:
User
: Filter hours according to the user who input them. This is the only compulsory field, and it defaults to the current user. Users with manager permissions are allowed to change it.
Start and end dates
: Filter hours according to their date. If the start date is left empty, the default value is the date of the first task inserted by the user; if the end date is empty, the default value is the current date.
There are quick-access buttons for common combinations of dates at
the bottom of the dates box.
The results are shown in the grid in the central area of the screen; rows represent projects and columns represent Total and Percentage hours. The former shows the total number of hours invested in a project in the selected time period and the latter shows the proportion of hours of one project regarding all the work done by the user in the same time period.
You can export the data contained in the grid to a CSV file for processing with spreadsheet software, for example, using the Download as CSV button at the bottom of the grid.
User evaluation
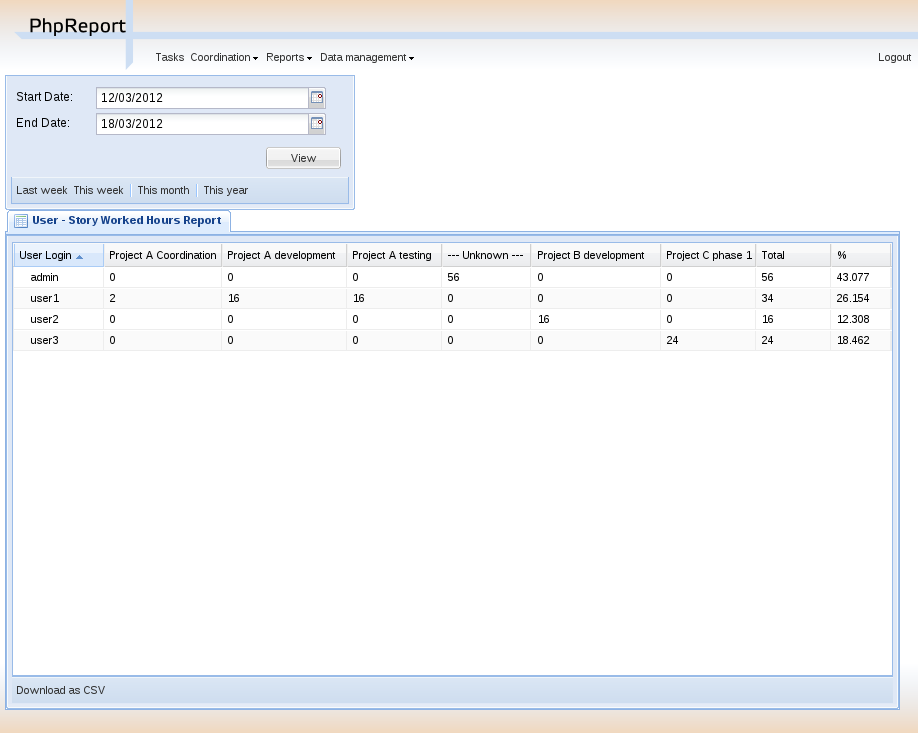
This report details the amount of work done by all the users in the system between two dates. It shows the time spent by every user on each story.
In the top of the screen there are two date inputs to insert the report dates: if the start date is left empty, the default value is the date of the first task inserted by the user; if the end date is empty, the default value is the current date. There are quick-access buttons for common combinations of dates at the bottom of the dates box.
The results are shown in the grid in the central area of the screen; rows represent users and columns represent stories (the field Story of every task, which we said it could be used to differentiate tasks). There are also two extra columns, Total and %; the former shows the total number of hours invested in a user, independently from the story (thus, it's the sum of all the story columns) and the latter shows the proportion of hours of one user regarding all the work done in the organization in that time period.
You can export the data contained in the grid to a CSV file for processing with spreadsheet software, for example, using the Download as CSV button at the bottom of the grid.
Accumulated hours
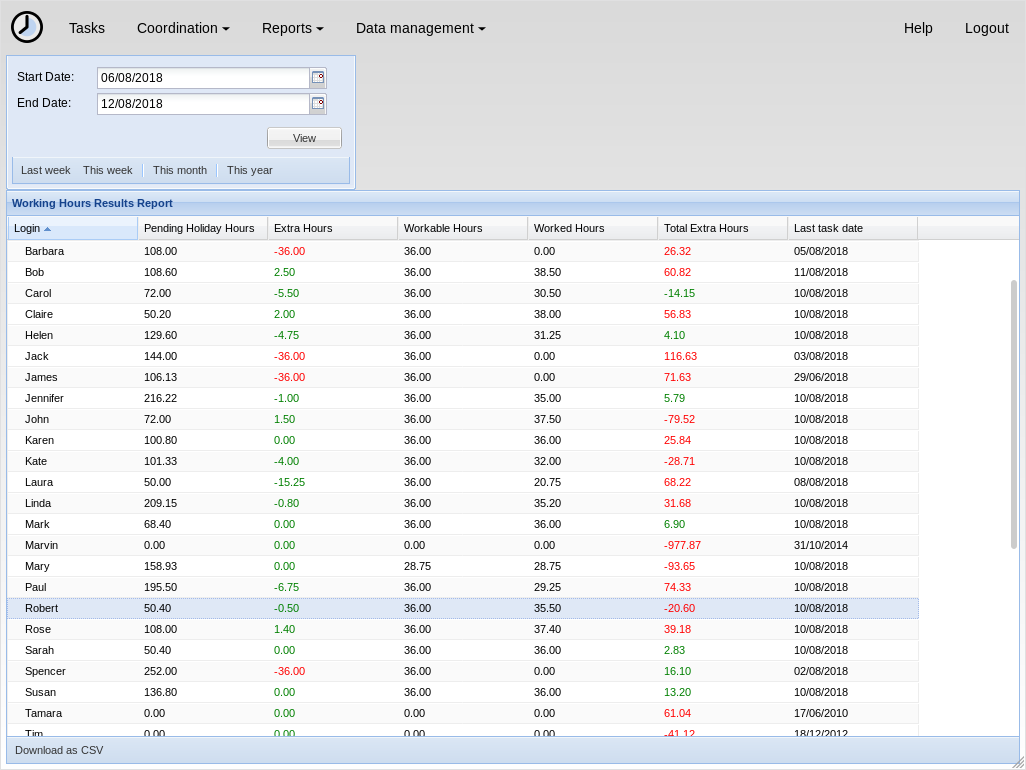
This report shows the difference of hours between every user's theoretical work journey and the actual number of hours worked, and the number of unused holiday hours. It shows the partial results between two dates and the total since the beginning of the history.
PhpReport assumes a work journey of X hours per day from Monday to Friday, and excluding public holidays. X is a variable that can be configured by managers for every user, in the user management screen.
In the top of the screen there are two date inputs to insert the report dates: if the start date is left empty, the default value is the date of the first contract period of every user; if the end date is empty, the default value is the current date. There are quick-access buttons for common combinations of dates at the bottom of the dates box.
The results are shown in the grid in the central area of the screen; rows represent users and columns represent the following data:
Pending holiday hours:
: it's the difference between the theoretical number of holiday hours for every user (calculated according to the explanation in Data model for holiday management) and the number of holiday hours used. The unused holidays are accumulated from one year to the next one; to see only the number of pending holidays in the current year, a start date in the current year must be chosen.
Extra hours:
: the difference of hours between the actual number of hours worked and the theoretical work journey, inside the specified time interval. It's the difference between the columns 'Worked hours' and 'Workable hours'.
Extra hour compensations are not taken into account when calculating
the value of this column.
Workable hours:
: theoretical number of hours every user should have worked in the specified time interval.
Worked hours:
: actual number of hours every user has worked in the specified time interval.
Total extra hours:
: the difference of hours between the actual number of hours worked and the theoretical work journey, taking into account all the history of the worker until the specified end date. It can be used to check side by side the partial value in 'Extra hours' column and the absolute value in this column. If the start date of the report is left empty, the values of these two columns are the same.
Extra hour compensations are taken into account when calculating the
value of this column. If the user has any compensation entry the
value of this column reflects the compensated value adding or
subtracting the extra hours since the date the compensation became
effective.
You can export the data contained in the grid to a CSV file for processing with spreadsheet software, for example, using the Download as CSV button at the bottom of the grid.
Project evaluation
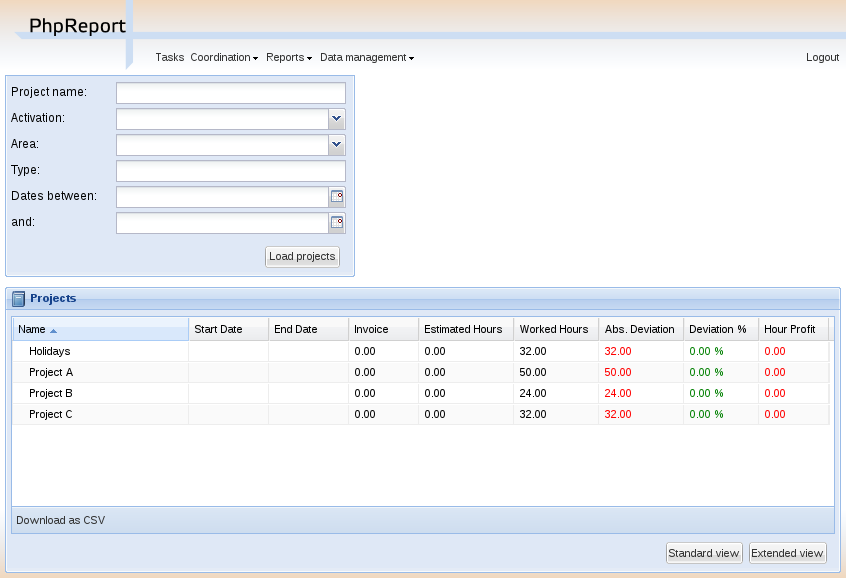
This report shows a list with projects and some data and statistics about them. There are different filtering options to select the projects to be listed.
In the top of the screen there are different filtering options to be applied to the list of projects. Leaving an option empty means not taking into account that field. The options are:
Project name:
: The name of the project must contain the words entered here.
Customer name:
: The customer of the project must contain the words entered here.
Activation:
: Check whether the project is active or not.
Area:
: Only projects belonging to a specific area.
Type:
: The type of the project must match the string entered here.
Dates between ... and ...:
: Filter the projects which start and end dates intersect with the time interval specified in these two fields.
The results are shown in the grid in the central area of the screen; rows represent projects and columns represent the following data:
Name:
: Name of the project.
Start date:
: Start date of the project.
End date:
: End date of the project.
Invoice:
: Expected invoiced of the project, entered by the manager when the project is created.
Estimated hours:
: Number of hours expected to be devoted to the project, entered by the manager when the project is created.
Worked hours:
: Actual number of hours devoted to the project.
Abs. deviation:
: Difference between the hours estimated and worked (estimated - worked).
Deviation %:
: Percentage of the deviation regarding the estimation of hours: (estimated - worked) / estimated.
Hour profit:
: Calculation of the profit obtained per hour spent in the project. It is calculated as: (invoice - cost) / worked hours.
In the bottom of the grid there are two buttons named Standard and Extended view. The second one adds some additional columns:
Activation:
: Activation status of the project.
Area:
: Value of the field area.
Total cost:
: Cost of the project, it's calculated using the cost per hour of each developer, multipled by the number of hours devoted to the project.
Total profit:
: It's the difference between the invoice and the cost (invoice - cost).
Moved hours:
: Number of hours moved out of the project. The moved hours are not taken into account to calculate the deviation or the estimated invoice per hour.
Est. hours invoice:
: Estimated invoice per hour. It's calculated as invoice / est. hours.
Work hours invoice:
: Actual invoice per hour. It's calculated as invoice / worked hours.
Schedule:
: Value of the field schedule.
Type:
: Value of the field type.
You can export the data contained in the grid to a CSV file for processing with spreadsheet software, for example, using the Download as CSV button at the bottom of the grid.
Finally, double-clicking on a row or selecting it and using the Details button above the grid will open the project details page for the corresponding project.
Project details
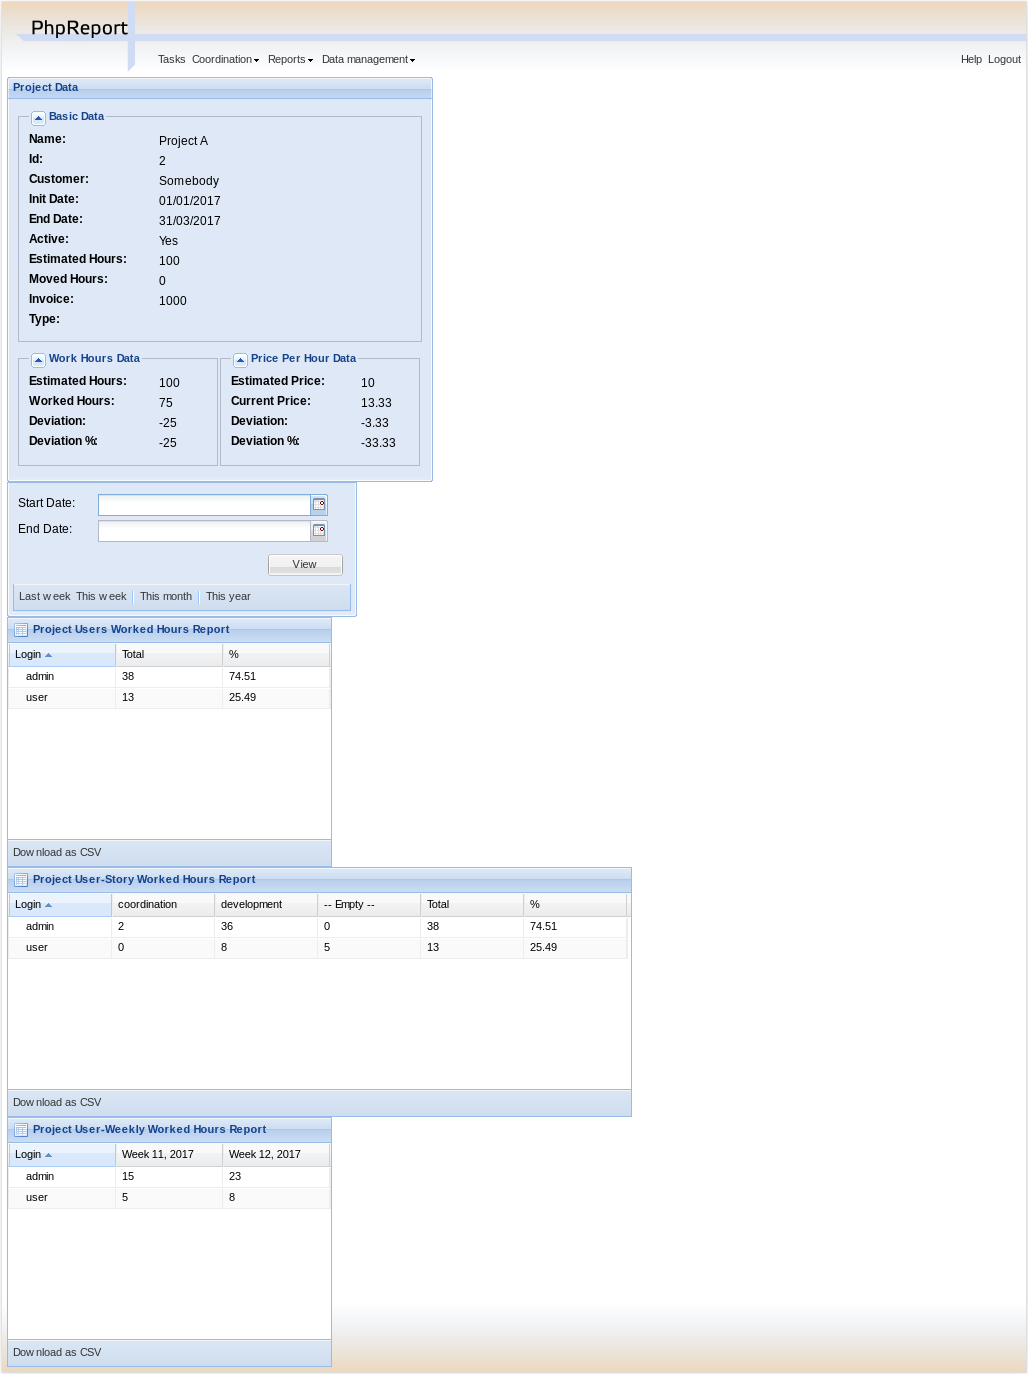
In this report we can see the details of a specific project, and the time devoted to this project split by worker and customer or story.
The Project details menu entry is actually a landing page to select one project among those currently active. This report can also be reached through the results of the Project evaluation report.
In the top of the screen there are different values and metrics for the project:
Name:
: Name of the project.
Id:
: Internal ID of the project.
Init date:
: Start date of the project.
End date:
: End date of the project.
Active:
: Activation status of the project. It will be red if the project has surpassed the end date and it's still active; it will be green otherwise.
Estimated hours:
: Number of hours expected to be devoted to the project, entered by the manager when the project is created.
Moved hours:
: Number of hours moved out of the project. The moved hours are not taken into account to calculate the deviation or the estimated invoice per hour.
Invoice:
: Expected invoiced of the project, entered by the manager when the project is created.
Type:
: Value of the field type.
Work hours data: estimated hours:
: Number of hours expected to be devoted to the project minus the moved hours.
Work hours data: worked hours:
: Actual number of hours devoted to the project.
Work hours data: deviation:
: Difference between the hours estimated and worked (estimated - worked).
Work hours data: deviation %:
: Percentage of the deviation regarding the estimation of hours: (estimated - worked) / estimated.
Price per hour data: estimated price:
: Estimated invoice per hour. It's calculated as invoice / est. hours.
Price per hour data: current price:
: Actual invoice per hour. It's calculated as invoice / worked hours.
Price per hour data: deviation:
: Absolute difference between the price estimated and actual (estimated price - current price).
Price per hour data: deviation %:
: Percentage of the deviation regarding the estimation of hours: (estimated - worked) / estimated. Percentage of the price deviation regarding the original estimation: (estimated price - current price) / estimated price.
Below the project data, there are two date inputs to insert the report dates: if the start date is left empty, the default value is the date of the first task assigned to the project; if the end date is empty, the default value is the current date. There are quick-access buttons for common combinations of dates at the bottom of the dates box.
The results are shown in three grids at the bottom area of the screen:
Worked hours report:
: Total and percentage of hours devoted by every user to the project in the selected time period.
Story worked hours report:
: Hours devoted by every user to the project in the selected time period, classified by the Story field. It also has Total and Percentage columns for every user, the former is the sum of all the different client/story columns and the latter is the proportion of hours of one user regarding all the work done in the project inside the same time period.
Weekly worked hours report:
: Hours devoted by every user to the project in the selected time period, classified by calendar week.
You can export the data contained in the grids to a CSV file for processing with spreadsheet software, for example, using the Download as CSV button at the bottom of the grid.
Projects summary
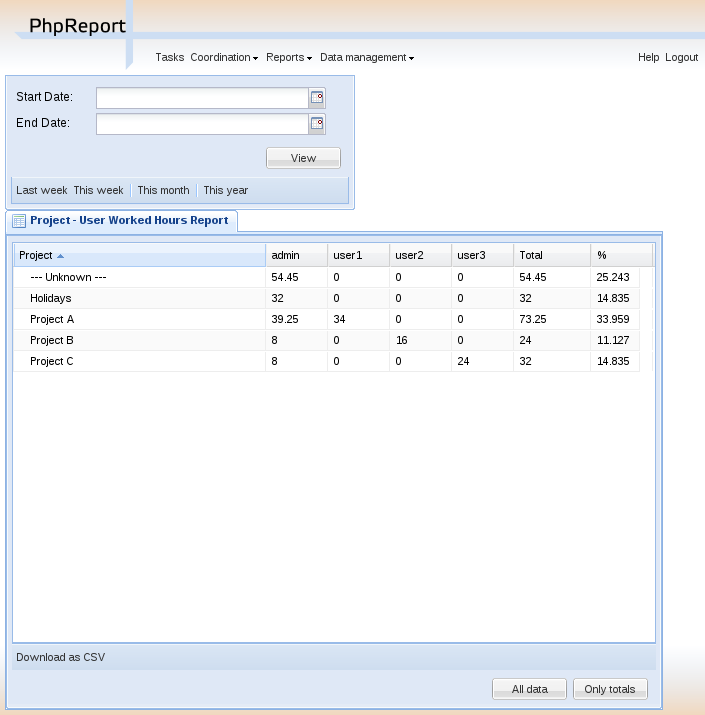
This report summarizes the work registered by the tool between two dates, split by projects and workers.
In the top of the screen there are two date inputs to insert the report dates: if the start date is left empty, the default value is the date of the first task inserted in the system; if the end date is empty, the default value is the current date. There are quick-access buttons for common combinations of dates at the bottom of the dates box.
The report itself consists on a grid where all the hours are split by projects and users; rows represent projects and columns represent users. There are two extra columns, Total and Percentage; the former shows the total number of hours devoted to the project (thus, it's the sum of all the different user columns) and the latter shows the proportion of hours of one project regarding the work done in all projects.
You can export the data contained in the grid to a CSV file for processing with spreadsheet software, for example, using the Download as CSV button at the bottom of the grid.
Finally, at the bottom of the box containing the grid there are two buttons named All data and Only totals. The latter hides all columns excepting Project, Total and Percentage, while the former shows all columns again.
Vacation summary
This report shows the holiday information for the year in course, about all or a subset of users.
By default, it will list all the active users in the system. There is a filter available to show only the users assigned to one specific, active project.
Every row in the grid represents a user, and for every user we display their configured area and journey, the number of holiday hours and their status (available, used, scheduled, pending), the percentage of scheduled/available, and finally a detailed view of the days of holidays used for every week in the year.
You can export the displayed data to a CSV file, using the Download report button at the bottom.
Projects management
PhpReport provides an interface to create, edit and remove projects, and assign them to users and clients. It can be accessed from the Data management menu, section Projects.

Create, edit and delete projects
In the Project management screen you will see a grid containing all the projects, sorted by start date by default; this can be changed pressing on the corresponding column.

To create a new project you must use the Add button located above the grid, and to edit a project you must double click on the corresponding row or click once to select it and then press the Edit button, also located above the grid.
In both cases, the following subwindow will appear:
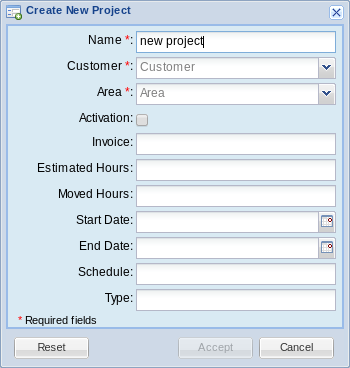
In the window you must enter the data of the project:
Name:
: Name of the project.
Customer:
: Customer the project will be assigned to.
Area:
: Area of the company this project belongs to.
Activation:
: Activation status of the project. If it's not active it doesn't appear in the tasks screen and no hours can be entered.
Invoice:
: Expected invoiced of the project.
Estimated hours:
: Number of hours expected to be devoted to the project.
Moved hours:
: Number of hours moved out of the project. The moved hours are not taken into account to calculate the deviation or the estimated invoice per hour.
Start date:
: Start date of the project.
End date:
: Theoretical end date of the project.
Schedule:
: Legacy field containing the type of schedule of the project. Now it can contain any text.
Type:
: Legacy field containing the type of the project. Now it can contain any text.
The Reset button allows you to to return the data in the window to the original state, while the Accept and Cancel buttons will save or discard your changes, respectively.
With the Delete button located above the projects grid you can remove the selected project. You will be asked for confirmation before actually trying to delete. If there are any assignations of tasks, clients or users to the project, you won't be allowed to delete it. You have to remove those assignations and try the deletion later.
Finally, the last button, Details, will open the project details report for the selected project.
Assigning users
To assign users to the selected project, press the Assign People button located above the projects grid. The following subwindow will appear:

To assign a user, you have to drag it from the right list and drop it on the left list. Only the users assigned to the area to which the project belongs are shown in the list by default; if you want to assign a user who's not in the list, check the Show all Users box.
Once you're done, press the Accept button to save the assignment or Cancel to discard it. You can also use the Reset button to return the data in the window to the original state.
::: tip ::: title Tip :::
You can select more than one user to drag'n'drop them at once, using the Ctrl or Shift keys. :::
Users management
PhpReport provides an interface to create, edit and remove users, and assign their hour cost, journey, area membership and city residence data. It can be accessed from the Data management menu, section Users.
Create, edit and delete users
In the Users management screen you will see a grid containing all the users, sorted by login by default; this can be changed pressing on the corresponding column.

To create a new user you must use the Add button located above the grid, and to edit an existing user you must double-click on the corresponding row.
In both cases, the following inline edition row will appear:
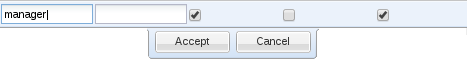
In the row you must enter the data of the user:
Login:
: User name, to be used in the login screen and to appear in the reports.
Password:
: Password to be used in the login screen.
Staff:
: Belonging to the staff group. Activating it the user will be able to login, fill tasks in and check some reports. In particular, they will have access to User tasks, User details, Accumulated hours and Project details, only of those projects they are assigned to.
Manager:
: Belonging to the manager group, users will have access to all kinds of reports, as well as using the User filter in the User tasks report to chose any other user.
Admin:
: Belonging to the administrators group. Activating it the user will be able to use the screens under Data management section: manage projects, users, etc.
Permission levels are meant to be stacked; e.g. it doesn't make sense to have a Manager user that doesn't belong to the staff group too.
::: tip ::: title Tip :::
If LDAP authentication is set, you won't be able to edit these user data. Besides, columns Staff and Admin may not appear, and the names of the groups in the LDAP server would appear instead. :::
To delete a user you must select it with a single click on the corresponding row and use the Delete button located next to Add button. You will be asked for confirmation before actually trying to delete. Users who have been assigned to some project, or who have already entered some tasks, won't be allowed to be deleted. You have to remove existing assignations or tasks and try the deletion later.
Setting the hour cost for a user
The hour cost for a user will be used to calculate the Total cost for a project, taking into account the time every user has contributed to that project. The total cost of a project can be checked in the Project evaluation report.
Hour cost may vary with time, so you will have to enter an Init date and End date for every value of hour cost in PhpReport. You can do it in the Users management screen, selecting one user (doing a single click on a row) and expanding the panel named User Histories located below the users grid. The first tab in this panel corresponds to Hour Cost:

As you can see, every row has three values: Init date, End date and Hour Cost. To create a new row, you must use the Add button, and to edit a row you must double click on it. In both cases an inline edition row will appear and you will be able to enter the three values. Once you have entered them you can Accept to save the changes. To delete a row you must select it with a single click and use the Delete button.
::: warning ::: title Warning :::
Overlapping time periods among different rows are not allowed. :::
Setting the journey for a user
The journey is the number of hours the person is supposed to work for every working day. Working days in PhpReport are Monday to Friday. This value will be used to calculate the balance of Extra hours for a user, as well as the corresponding amount of Holiday hours. These values can be checked in the Accumulated hours report.
This value may vary with time (e.g. a user may change from full time to part-time dedication for a specific period of time), so you will have to enter an Init date and End date for every value of user journey in PhpReport. You can do it in the Users management screen, selecting one user (doing a single click on a row) and expanding the panel named User Histories located below the users grid. The second tab in this panel is Journey:
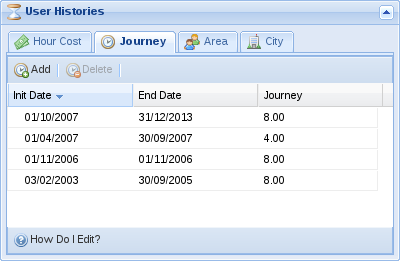
As you can see, every row has three values: Init date, End date and Journey. To create a new row, you must use the Add button, and to edit a row you must double click on it. In both cases an inline edition row will appear and you will be able to enter the three values. Once you have entered them you can Accept to save the changes. To delete a row you must select it with a single click and use the Delete button.
::: warning ::: title Warning :::
Overlapping time periods among different rows are not allowed. :::
Setting the area for a user
Areas are the way to translate a department structure to PhpReport; you can assign a user to an area for a defined period of time. Like in the previous values, you will have to enter an Init date and End date for every value of user area in PhpReport. You can do it in the Users management screen, selecting one user (doing a single click on a row) and expanding the panel named User Histories located below the users grid. The second tab in this panel is Area:
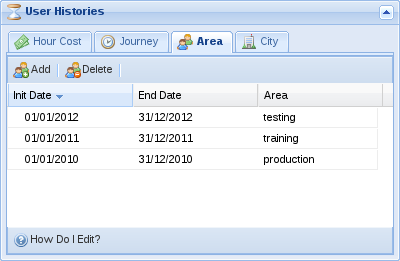
As you can see, every row has three values: Init date, End date and Area. To create a new row, you must use the Add button, and to edit a row you must double click on it. In both cases an inline edition row will appear and you will be able to enter the three values. Once you have entered them you can Accept to save the changes. To delete a row you must select it with a single click and use the Delete button.
::: warning ::: title Warning :::
Overlapping time periods among different rows are not allowed. :::
Setting the city for a user
Users may be assigned to a city. The city has influence in the working days of users, because they translate the public holidays of every city to user hours accountability. Public holidays work like weekends: users are not supposed to work in those days, and when they do, the hours are accounted as extra hours.
This value may vary with time (e.g. a user moving to a work center located in a different city), so you will have to enter an Init date and End date for every value of user city in PhpReport. You can do it in the Users management screen, selecting one user (doing a single click on a row) and expanding the panel named User Histories located below the users grid. The second tab in this panel is City:
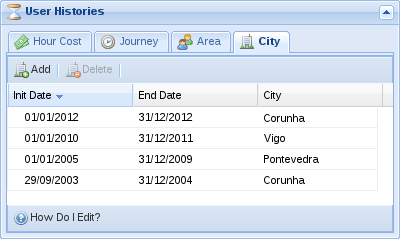
As you can see, every row has three values: Init date, End date and City. To create a new row, you must use the Add button, and to edit a row you must double click on it. In both cases an inline edition row will appear and you will be able to enter the three values. Once you have entered them you can Accept to save the changes. To delete a row you must select it with a single click and use the Delete button.
::: warning ::: title Warning :::
Overlapping time periods among different rows are not allowed. :::
Setting user custom goals
Goals are used to fulfil specific accumulated hour goals per user in a specific period of time. Every goal will have Init date, End date and Extra hours: dates actually refer to the week they belong, e.g. setting Init date to Monday or Thursday of the same week makes no difference; the Extra hours field is the number of accumulated hours that a user must have in the specified period to fulfill the goal, it should be equal to the value of worked hours minus workable hours between Monday of the init date week and Sunday of the end date week.
The weekly goal value in the User work summary shows how many hours they should work every week to fulfil their goal when they reach the end date. The value will vary every week according to how far or close they are to fulfill their goal.
When no custom goal is set, users will get a default goal. The default goal starts on the beginning of the year, on the user journey start date or on the end date of a previous custom goal, whatever is more recent; it ends at the end of the year, the end of the journey or the beginning of a future custom goal, whatever is closer in time. The extra hours value of the default goal is 0. For the most common cases, a default goals is equivalent to setting 1st Jan as init date, 31st Dec as end date and 0 as extra hours.
Filling long leave periods for absent users
Sometimes, an admin needs to fill long periods of sick leave or other kinds of leaves for an absent user. There is an interface to accomplish this, it can be accessed from the Data management menu, section Long leaves.
You need to fill in the following data:
Type of leave:
: The project the leave will be assigned to. To have projects listed here, they need to have been saved with the project type "leave" in the Projects management area.
User:
: User the leave will be assigned to.
Start and end dates:
: When the leave will start and end. One task will be created for every day between those dates, excluding weekends.
Description:
: Optional text to be added in the task description.
::: warning ::: title Warning :::
Make sure the details are correctly filled as there is no interface to remove multiple leaves at once. :::
Clients management
PhpReport provides an interface to create, edit and remove clients. It can be accessed from the Data management menu, section Clients.
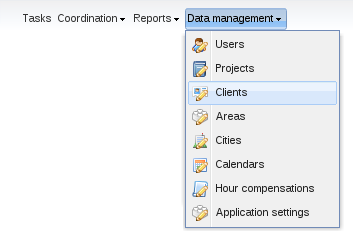
Create, edit and delete clients
In the Clients management screen you will see a grid containing all the clients stored in the system, sorted by name by default; this can be changed pressing on the corresponding column. Below the grid with the clients there is another grid containing the list of sectors in the system, explained later.
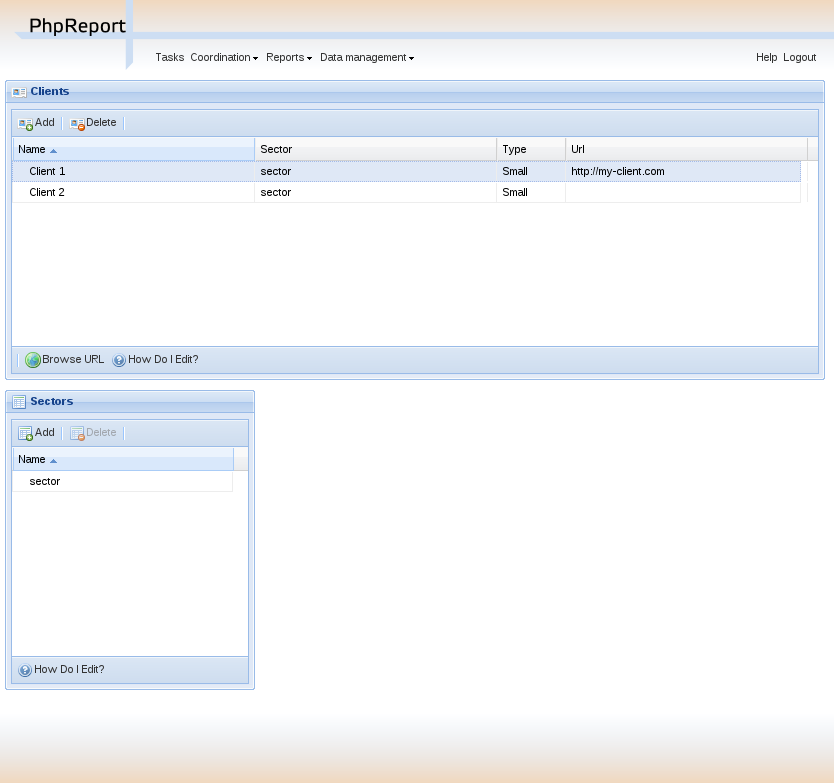
To create a new client you must use the Add button located above the grid, and to edit a client you must double-click on the corresponding row.
In both cases, the following inline edition row will appear:
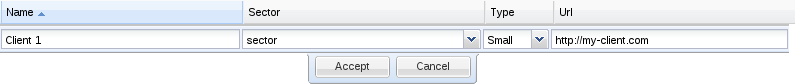
In the row you must enter the data of the user:
Name:
: Name of the client.
Sector:
: Sector the client belongs to. To be selected among one of the sectors in the list.
Type:
: Another field to classify the clients. Values are small, medium and large.
Url:
: An optional URL pointing to the website of the client.
To delete a client you must select it with a single click on the corresponding row and use the Delete button located next to Add button. You will be asked for confirmation before actually trying to delete. If the client is assigned to some project you won't be allowed to delete it. You have to remove the existing assignations from projects or tasks to this client and try the deletion later.
Create, edit and delete sectors
In the Clients management screen you will also be able to maintain a list of Sectors, which are a grouping field for clients. There can be any number of sectors, and their names are editable. They can be created, edited or deleted using the grid below the one with the clients.
To create a new sector you must use the Add button located above the grid, and to edit a sector you must double-click on the corresponding row. In both cases, an inline edition row will appear; the only editable field is the name of the sector.
To delete a sector you must select it with a single click on the corresponding row and use the Delete button located next to Add button. You will be asked for confirmation before actually trying to delete. If the sector is assigned to some client you won't be allowed to delete it. You have to remove the existing assignations to clients and try the deletion later.
Cities and work calendars management
PhpReport provides interfaces to create, edit and remove cities and the calendars attached to them.
Create, edit and delete cities
In the Cities management screen you will be able to create, edit and delete cities. It can be accessed from the Data management menu, section Cities.

This interface consists of a grid containing the list of cities stored in the system, sorted by name.

To create a new city you must use the Add button located above the grid, and to edit a city you must double-click on the corresponding row. In both cases, an inline edition row will appear; the only editable field is the name of the city.
To delete a city you must select it with a single click on the corresponding row and use the Delete button located next to Add button. You will be asked for confirmation before actually trying to delete. If the city is assigned to some user, or if you have added any days to its calendar, you won't be allowed to delete it. You have to remove these associated data and try the deletion later.
Work calendars management
In the Calendars management screen you will be able to select the public holidays associated to every city. It can be accessed from the Data management menu, section Calendars.

In this screen you will see a big calendar, and two small selectors on the side, together with the save button.
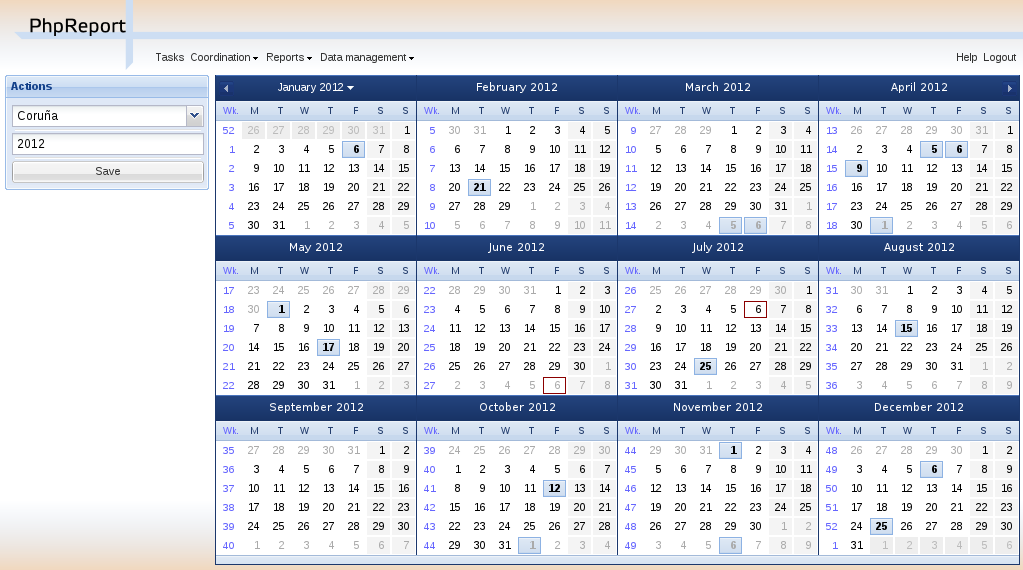
First of all, you have to select a city among the ones present in the system, using the combo box on the left side. Then you should select a year in the text box below, by default the current year is set.
To add public holidays you only have to click on the days directy on the calendar. Clicking again on an already selected day will remove it. When you are done, press the Save button located on the left side.
If you change the selected city, any unsaved changes will be lost, but the application will warn you before letting it happen. On the other hand, you can change the selected year without fear of losing the changes.
Management of other entities
There are some other entities in PhpReport, not mentioned before, with their own management interfaces.
Create, edit and delete areas
In the Areas management screen you will be able to create, edit and delete areas. It can be accessed from the Data management menu, section Areas.
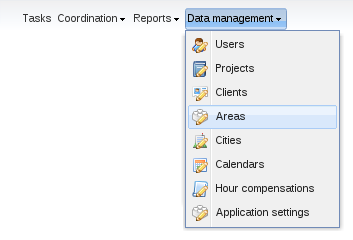
This interface consists of a grid containing the list of areas stored in the system, sorted by name.

To create a new area you must use the Add button located above the grid, and to edit an area you must double-click on the corresponding row. In both cases, an inline edition row will appear; the only editable field is the name of the area.
To delete an area you must select it with a single click on the corresponding row and use the Delete button located next to Add button. You will be asked for confirmation before actually trying to delete. If there are any users or projects assigned to that area, you won't be allowed to delete it. You have to remove these associations and try the deletion later.
Create, edit and delete extra hours compensations
In the Hour compensations management screen you will be able to create, edit and delete extra hours compensations. It can be accessed from the Data management menu, section Hour compensations.
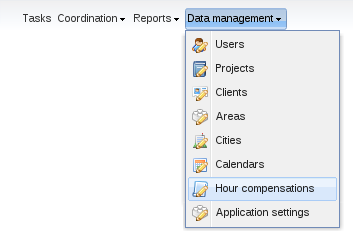
This interface consists of a grid containing the list of areas stored in the system, sorted by date.
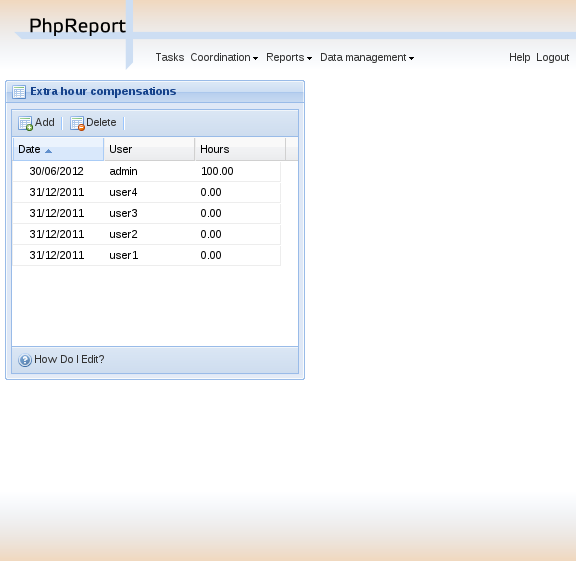
To create a new compensation you must use the Add button located above the grid, and to edit a compensation you must double-click on the corresponding row. In both cases, an inline edition row will appear, where you can edit the fields date, user and hours.
To delete a compensation you must select it with a single click on the corresponding row and use the Delete button located next to Add button. You will be asked for confirmation before actually trying to delete.
Settings management
PhpReport provides a web interface to configure some system-wide settings. It can be accessed from the Data management menu, section Settings.

This is how the Settings management screen looks like:
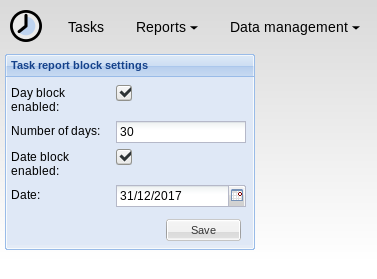
Task report block settings
Task reporting can be blocked depending on the selected date. There are two ways to configure how far in the past users are allowed to enter new tasks or to edit existing ones. They work independently, and the most restrictive of them will always apply.
There are four settings to configure this feature:
Day block enabled:
: If checked, task reports for dates older than a certain number of days cannot be modified. You will have to set the following value for this setting to work.
Number of days:
: The number of days in the past to activate the block. The minimum value is 1, which would block the day before the current date. Setting it to 0 or leaving it empty would disable the feature.
For example, setting this value to seven will prevent users from
entering tasks older than a week.
Date block enabled:
: If checked, dates before the selected date are locked. You will have to set the following value for this setting to work.
Date:
: If date block is enabled, tasks on this date or older than that cannot be edited.
For example, setting this value to 31/12/2017 will prevent users
from modifying tasks in 2017 or earlier.
PhpReport administrator documentation
PhpReport is a web application for time tracking, which provides useful statistics about users, projects, and more. These documents provide the basic concepts to install and configure PhpReport for system administrators.
- Installation instructions
- Installing in docker
- Upgrade instructions
- How to set up LDAP authentication
- Common problems
Installation instructions
Step 0: Dependencies
To install PhpReport in your system, you will need the following software:
- PostgreSQL database server (tested with PostgreSQL 9)
- PHP 7.3 or higher
- Support for PDO and PostgreSQL
- Web server (tested with Apache 2.x)
- PHP module
- Node.js with a version of 20 or higher
- NPM
- Python with a version of 3.11 or higher
- PIP
- The Alembic package for Python
Installing dependencies on selected GNU/Linux distros
Run the following command with root privileges:
- Ubuntu:
apt install postgresql apache2 php php-pgsql php-xml php-pdo nodejs npm python3 - Debian:
apt install postgresql apache2 php php-pgsql php-xml nodejs npm python3 - Fedora:
dnf install postgresql-server httpd php php-pgsql php-xml php-pdo nodejs npm python3
If you are installing PhpReport from sources instead of a release package, you must install composer to manage the project dependencies. Follow the official docs for the instructions: https://getcomposer.org/doc/00-intro.md#installation-linux-unix-macos
Step 1: Setting up the database
Connect to your database server as superuser, or a user with enough permissions to create databases and users.
Run the following command with root permissions:
su postgres -c psql
Once you have logged into PostgreSQL shell, run the following commands to create a database, a user and grant enough permissions (change the names and passwords if you feel like to, but remember it in the next steps):
CREATE DATABASE phpreport;
CREATE USER phpreport WITH PASSWORD 'phpreport';
ALTER DATABASE phpreport OWNER TO phpreport;
Step 2: Setting up the files
Move the program files to a location available for the web server,
inside a directory called phpreport. The usual default location for the
Apache web server is: /var/www/html/
If you are installing PhpReport from sources instead of a release
package, you must also run composer dump-autoload -o inside PhpReport
root directory, so it can generate the autoload files. Then, run
composer install to install the project dependencies.
Step 3: Creating the schema and initial data of the database
Now that Alembic has been set up in the project, database setup can be handled with it. Please see the section in the api documentation dealing with Alembic and running the migrations.
Legacy methods
You have two ways to do it: using the included web installation wizard or manually.
Installation wizard
As a precondition, your web server has to have write permissions on the
config directory of PhpReport to write the configuration file. Once that
is done, open the url
http://your-web-server/phpreport/install/index.php, and follow the
on-screen instructions. If you didn't change the names and passwords
specified in step 1, you won't need to modify the default values.
Manual setup of schema and initial data
Follow these steps only if you haven't used the installation wizard. In
first place, browse to the phpreport directory and create a
configuration file with the default options with the command:
cp .env.example .env
cp frontend/.env.example frontend/.env
If you changed any of data on the first step, edit the file
.env and set the correct values for the DB name, user,
password, host, etc.
Browse to the directory sql/ and run the following commands (you will
be asked by the password interactively, default is phpreport):
psql -h localhost -W -U phpreport phpreport < schema.sql
psql -h localhost -W -U phpreport phpreport < uniqueConstraints.sql
psql -h localhost -W -U phpreport phpreport < otherConstraints.sql
psql -h localhost -W -U phpreport phpreport < initialData.sql
psql -h localhost -W -U phpreport phpreport < update/all.sql
Set the correct DB name, user and host if they are different.
Step 4: Try the application
Use a browser to open the correct URL of your web server, and use the
user name admin and the password admin for the first time. You will
be able to create more users and change their passwords once you enter
the application.
Step 5: Remove dangerous files
Once the installation is complete and you have checked it is working,
remove the install/ and update/ directories inside your PhpReport,
to prevent other users from resetting your DB.
Step 6: Last configuration bits
You might have to modify some parameters in the file [.env] to match your work domain. In particular, you might have to modify the default total number of holiday hours for a full-time worker. It is specified by the [YEARLY_HOLIDAY_HOURS] attribute, and you have to modify the following line to change it:
YEARLY_HOLIDAY_HOURS=184
Remember to check the data model for holiday management to know how it works and which value you should put there.
Installing in docker
Method 1: Docker Compose
Build and start:
docker-compose up -d
Method 2: Docker alone
Step 0: Create a volume
In order to have persistent data, we can create a volume to store all the data there.
docker volume create phpreport
This will create a volume called [phpreport]{.title-ref}.
Step 1: Create the image
Now we can create the image that contains phpreport.
docker build . -t phpreport
This will create an image called [phpreport]{.title-ref}
Step 2: Starting a container with phpreport
Now we can start a phpreport in a container, using the previously created volume to have persistent data.
docker run -d -v phpreport:/var/lib/postgresql -p 80:80 phpreport
Post install
After a while, open http://localhost/phpreport with the browser.
The default user is [admin]{.title-ref} and default password is [admin]{.title-ref}.
Upgrade instructions
Please backup your database before running an upgrade, in case things go wrong during the process.
From version 2.21 to 2.22
Unpack the files of PhpReport 2.21 at the same location as the original
files, overwriting the existing contents. After that, run the upgrade
script located at the directory update/:
cd update
php -f update-from-2.21-to-2.22.php
Alternatively, you can open the following URL in your browser to run the script:
http://your-web-server/phpreport/update/update-from-2.21-to-2.22.php
This upgrade also adds several new values to config/config.php. Open
the file config/config.template and look for the message "New from
PhpReport 2.22". Copy the configuration parameters below that point to
your own config.php and customize them if necessary.
In 2.22 we have decided to remove the coordination features (XP tracker
and Analysis tracker). The UI and backend code have been removed, but
data model has not been altered. Any existing data from these features
will be preserved after the upgrade in the tables: iteration, story,
task_story, module, section and task_section.
Once the process is complete, remove the directories update/ and
install/ inside your PhpReport, to prevent other users from altering
your DB.
From version 2.20 to 2.21
Unpack the files of PhpReport 2.21 at the same location as the original
files, overwriting the existing contents. After that, run the upgrade
script located at the directory update/:
cd update
php -f update-from-2.20-to-2.21.php
Alternatively, you can open the following URL in your browser to run the script:
http://your-web-server/phpreport/update/update-from-2.20-to-2.21.php
This upgrade also adds several new values to config/config.php. Open
the file config/config.template and look for the message "New from
PhpReport 2.21". Copy the configuration parameters below that point to
your own config.php and customize them if necessary.
Once the process is complete, remove the directories update/ and
install/ inside your PhpReport, to prevent other users from altering
your DB.
From version 2.19 to 2.20
Unpack the files of PhpReport 2.20 at the same location as the original files, overwriting the existing contents.
There are no scripts to run or additional steps to be done in this
upgrade. Just make sure to remove the directories update/ and
install/ inside your PhpReport, to prevent other users from altering
your DB.
From version 2.18 to 2.19
Unpack the files of PhpReport 2.19 at the same location of the original files, overwriting the existing contents.
There are no scripts to be run in this upgrade, but several new values
were added to config/config.php. Open the file
config/config.template and look for the message "New from PhpReport
2.19". Copy the configuration parameters below that point to your own
config.php and customize them if necessary.
Once the process is complete, remove the directories update/ and
install/ inside your PhpReport, to prevent other users from altering
your DB.
From version 2.17 to 2.18
Unpack the files of PhpReport 2.18 at the same location of the original
files, overwriting the existing contents. After that run the upgrade
script located at the directory update/:
cd update
php -f update-from-2.17-to-2.18.php
Alternatively, you can open the following URL in your browser to run the script:
http://your-web-server/phpreport/update/update-from-2.17-to-2.18.php
This upgrade adds several new values to config/config.php. Open the
file config/config.template and look for the message "New from
PhpReport 2.18". Copy the configuration parameters below that point to
your own config.php and customize them if necessary.
Once the process is complete, remove the directories update/ and
install/ inside your PhpReport, to prevent other users from altering
your DB.
From version 2.16 to 2.17
Unpack the files of PhpReport 2.17 at the same location of the original
files, overwriting the existing contents. After that run the upgrade
script located at the directory update/:
cd update
php -f update-from-2.16-to-2.17.php
Alternatively, you can open the following URL in your browser to run the script:
http://your-web-server/phpreport/update/update-from-2.16-to-2.17.php
This upgrade will make task templates persistent. These used to be stored as browser cookies and, therefore, should be migrated by every individual user. Users willing to migrate their old templates must open this URL once:
http://your-web-server/phpreport/web/migrate-templates.php
Also take into account this upgrade simplifies the relation between
projects and customers. Any project assigned to more than one customer
will be reassigned to the most frequent customer. In case the default
assignment does not suit for you, you can use the old DB values to
fine-tune the migration: the table requests contains the relations
between customers and projects before the migration, and the field
customerid in the tasks table indicates the customer every task was
assigned to.
Finally, this upgrade also adds a new permission level called "manager". Standard users will see access to certain reports restricted, you need to decide which of your users require access to all reports and give them the "manager" role.
Once the process is complete, remove the directories update/ and
install/ inside your PhpReport, to prevent other users from altering
your DB.
From version 2.1 to 2.16
Unpack the files of PhpReport 2.16 at the same location of the original
files, overwriting the existing contents. After that run the upgrade
script located at the directory update/:
cd update
php -f update-from-2.1-to-2.16.php
Alternatively, you can open the following URL in your browser to run the script:
http://your-web-server/phpreport/update/update-from-2.1-to-2.16.php
Once the upgrade is complete, remove the directories update/ and
install/ inside your PhpReport, to prevent other users from altering
your DB.
From version 2.0 to 2.1
Unpack the files of PhpReport 2.1 at the same location of the original
files, overwriting the existing contents. After that run the upgrade
script located at the directory update/:
cd update
php -f update-from-2.0-to-2.1.php
Alternatively, you can open the following URL in your browser to run the script:
http://your-web-server/phpreport/update/update-from-2.0-to-2.1.php
Once the upgrade is complete, remove the directories update/ and
install/ inside your PhpReport, to prevent other users from altering
your DB.
Due to a bug in the installation wizard, people who installed PhpReport using this method will find the following error during the upgrade process:
Error updating database in step: .../remove-triggers-for-overlapping-control.sql
Please consider doing a manual update
If this is the only error message, you can safely ignore it: the migration has been completed successfully.
Between any 2.x versions
You can migrate between any 2.x releases by unpacking the files of the latest release at the same location of the original files, overwriting the existing contents, and then running the upgrade scripts in order. For example, if you are migrating from 2.1 to 2.17:
cd update
php -f update-from-2.1-to-2.16.php
php -f update-from-2.16-to-2.17.php
Please, also read carefully the documentation about every individual
step in the sections above. You may also have to update your
config/config.php file as explained there.
Remember to remove the directories update/ and install/ inside your
PhpReport when the migration is done.
From version 1.x to 2.0
PhpReport 2.0 is a completely new application written from scratch. We have provided a DB upgrade script but the migration is a bit tricky and results are not guaranteed. For these reasons, you will have to install PhpReport 2.0 in a new location and create a new DB for it which needs to be available side by side with PhpReport 1.x database during the migration.
Begin following the installation instructions from
steps 0 to 2. Take into account you will probably have to use a
different name for the DB and extract the files to a different directory
to avoid conflicts with the existing installation. At step 3 you must
follow the manual setup instructions, but you must not run the command
that adds initialData.sql to the DB.
Now you have to run the script from the command line, indicating the host, port, database name, user and password for both the 1.x database (source) and 2.0 database (destination):
cd update
php -f migration.php source-host source-port source-db source-db-user
      source-db-password destination-host destination-port
      destination-db destination-db-user destination-db-password
During the process you might be asked some questions to resolve
migration conflicts. Finally, when the process is complete, test the
application, and remember to remove the directories update/ and
install/ to prevent other users from altering your DB.
How to set up LDAP authentication
The implementation of LDAP authentication connectors is robust, but its configuration is a bit "hackish". In any case, if you want to go on you need to edit the file [config/config.php]{.title-ref} as explained below.
As a precondition, you will need an extra dependency in your system:
- Debian: php-ldap
- Ubuntu/Fedora/RHEL: php-ldap
First, locate the following block of lines and edit them according to your LDAP server settings:
// LDAP connection configuration

/**
 * @name LDAP_SERVER
 * @global string LDAP server ip or name
 */
define('LDAP_SERVER', 'localhost');

/**
 * @name LDAP_PORT
 * @global int LDAP server port
 */
define('LDAP_PORT', 389);

/**
 * @name LDAP_BASE
 * @global string LDAP base OIDs
 */
define('LDAP_BASE', 'dc=igalia,dc=com');
After that, locate the following block of lines and uncomment them to enable the code that implements LDAP authentication in PhpReport (don't modify the content of the lines, only uncomment them):
// uncomment the next lines to enable LDAP user authentication

/**
 * @name USER_DAO
 * @global string User DAO implementation used
 */
define('USER_DAO', 'HybridUserDAO');
/**
 * @name USER_GROUP_DAO
 * @global string User Group DAO implementation used
 */
define('USER_GROUP_DAO', 'LDAPUserGroupDAO');
/**
 * @name BELONGS_DAO
 * @global string Belongs DAO implementation used
 */
define('BELONGS_DAO', 'LDAPBelongsDAO');

// end lines for LDAP user authentication
You might need to modify two more lines at [config/config.php]{.title-ref} to match your LDAP group structure. The following code indicates which is the name of the most basic group of users, the one that contains all the members that will use PhpReport:
/**
 * @name ALL_USERS_GROUP
 * @global string users group used for retrieving all users
 */
define('ALL_USERS_GROUP', 'staff');
You can also define a group to display only active employees based on its respective LDAP group:
/**
 * @name EMPLOYEES_GROUP
 * @global string users group used for retrieving all active employees
 */
define('EMPLOYEES_GROUP', 'employees');
And in this line you must indicate a list with the names of the user groups that will have some meaning for PhpReport:
/**
 * @name USER_GROUPS
 * @global string all user groups for displaying on the interfaces as
 * a serialized array, compulsory when using LDAP user authentication
 */
define('USER_GROUPS', serialize(array('staff', 'admin')));
Once you have set the groups up, you can specify the pages and web services each group is allowed to enter modifying the file [config/permission.php]{.title-ref}. Usually you would like to have a staff and an admin group so you would only need to modify that file to replace the default group names with the actual ones.
Finally, take into account that users must still exist both in your database and your LDAP server, and in this state of the configuration you cannot log into PhpReport because users don't fulfill both conditions. You should log into your database and add users manually with the following commands:
psql -h localhost -W -U phpreport phpreport

insert into usr(login) values ('username1');
insert into usr(login) values ('username2');
etc.
Common problems
PostgreSQL service is running but installation wizard seems to be unable to connect to it
Probably your PostgreSQL server isn't allowing incoming connections
through the network. Check the file pg_hba.conf (location in Fedora:
/var/lib/pgsql/data/, Debian/Ubuntu:
/etc/postgresql/<version>/main/). You will probably need to add the
following lines:
# TYPE  DATABASE        USER            CIDR-ADDRESS            METHOD
# IPv4 local connections:
host    all             all             127.0.0.1/32            md5
# IPv6 local connections:
host    all             all             ::1/128                 md5
If your system uses SELinux (Fedora does), you also need to allow network connections from Apache to the database with:
setsebool -P httpd_can_network_connect_db 1
I can't start PostgreSQL server service in Fedora
Maybe you haven't set the storage files up. Check the actual reason of your problem with:
# systemctl status postgresql.service
systemd[1]: Starting PostgreSQL database server...
postgresql-check-db-dir[10598]: Directory "/var/lib/pgsql/data" is missing or empty.
postgresql-check-db-dir[10598]: Use "/usr/bin/postgresql-setup --initdb"
postgresql-check-db-dir[10598]: to initialize the database cluster.
postgresql-check-db-dir[10598]: See /usr/share/doc/postgresql/README.rpm-dist for more informa
systemd[1]: postgresql.service: Control process exited, code=exited status=1
Follow the instructions to fix it:
# /usr/bin/postgresql-setup --initdb
* Initializing database in '/var/lib/pgsql/data'
* Initialized, logs are in /var/lib/pgsql/initdb_postgresql.log
There's an error message: 'It is not safe to rely on the system's timezone settings'
Edit the configuration file php.ini, adding a line like the following
one but changing Europe/Madrid with your own time zone:
date.timezone = Europe/Madrid
php.ini is usually located in:
- Debian, Ubuntu:
/etc/php5/apache2/php.ini - Fedora, Red Hat:
/etc/php.ini - Windows:
C:\PHP\php.ini
There are a lot of warning and error messages mixed with the content of the web application
Disable error output in PHP settings. Edit the configuration file
php.ini and locate the parameter display_errors, changing its value to
off:
display_errors = Off